
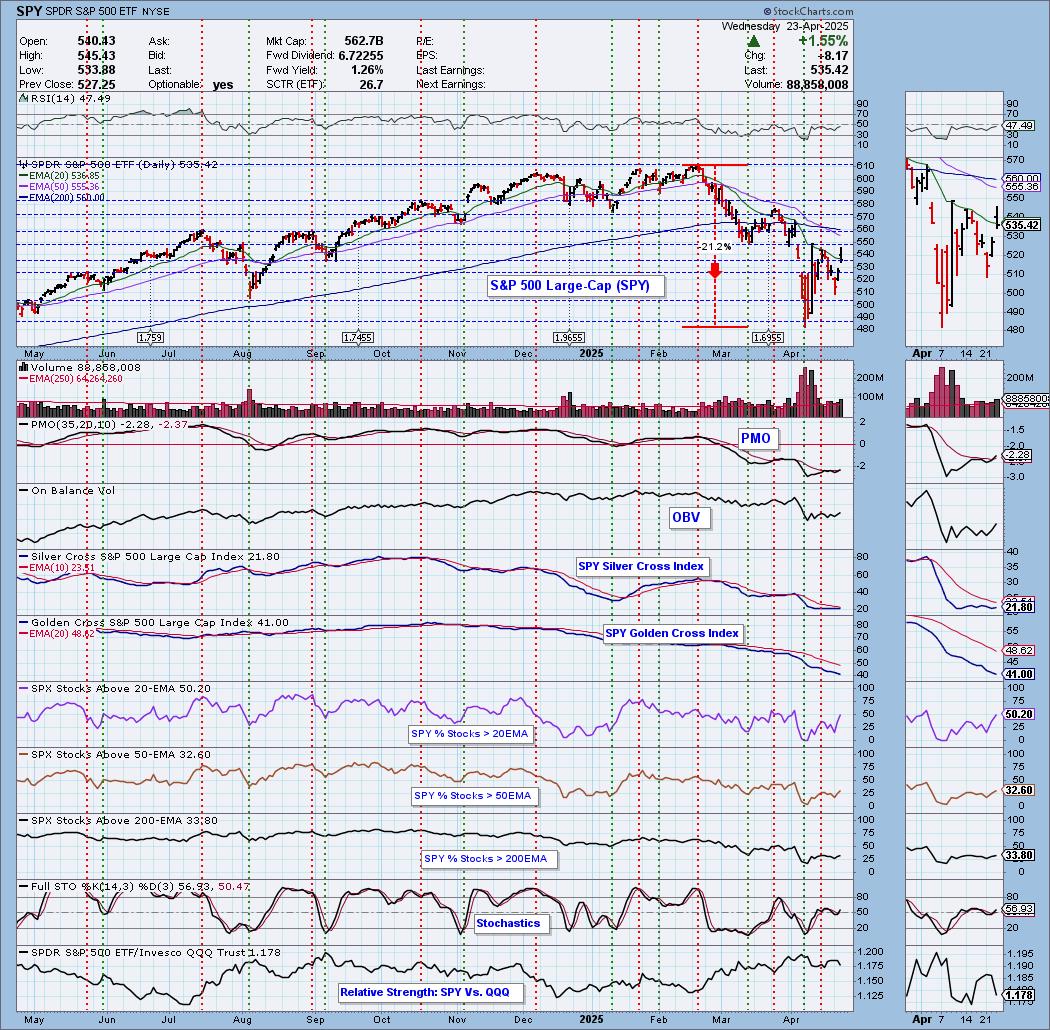
With the SPY closing below the open today, we saw a plethora of filled black candlesticks. These are bearish candlesticks. They are one day patterns that call out for the next day to close lower. There is a good chance we will see some decline coming tomorrow among many stocks. Of course the market has tended to surprise so it remains to be seen whether this bear market rally is already over.
I did have quite a few results in my ETF scans today, but most I was unimpressed with. Unfortunately all of them had intermediate-term declining trends, but some are seeing nice rallies right now and that could portend higher prices in the near term despite the wobbly market.
I didn't include it today because it is too high risk to present right now, but BDRY, the Dry Bulk Shipping ETF looks extremely interesting. It could carry with it a lot of volatility as it is very low priced, but the upside potential looked incredible, I just wasn't a fan of presenting something that risky in Diamonds.
I have two international flavored ETFs and the Insurance ETF, KIE. I also noticed Healthcare popped up as well as Financials. I think they look interesting, but they didn't grab my attention as much as the other ETFs.
Tomorrow is Reader Request day! There are far more choices out there so take a moment and send a symbol or more to me right now!
Good Luck & Good Trading,
Erin
Today's "Diamonds in the Rough": EEM, EWH and KIE.
Runner-ups: XLF, XLV, IAK, IXJ, BDRY, SMCY, CPER, EWZ, ITA and AAXJ.

Diamond Mine Trading Room:
RECORDING & DOWNLOAD LINK (4/17/2025):
Topic: DecisionPoint Diamond Mine (4/17/2025) LIVE Trading Room
Recording & Download LINK
Passcode: April#17
REGISTRATION for 4/25/2025:
When: April 25, 2025 09:00 AM Pacific Time (US and Canada)
Topic: DecisionPoint Diamond Mine LIVE Trading Room
Register in advance for this webinar HERE
After registering, you will receive a confirmation email containing information about joining the webinar.

Below is the latest free DecisionPoint Trading Room recording from 4/21. You'll find these recordings posted on Mondays to our DP YouTube Channel. Be sure and subscribe HERE.
Welcome to DecisionPoint Diamonds, wherein I highlight ten "Diamonds in the Rough" per week. These are selected from the results of my DecisionPoint Scans which search for stocks that could benefit from the trend and condition of the market. Remember, these are not recommendations to buy or sell, but are the most interesting of the stocks that surfaced in my scans. My objective is to save you the work of the initial, tedious culling process, but you need to apply your own analysis to see if these stocks pique your interest as well. There are no guaranteed winners here!
"Predefined Scans Triggered" are taken from StockCharts.com using the "Symbol Summary" option instead of a "SharpChart" on the workbench.
Stop levels are all rounded down.
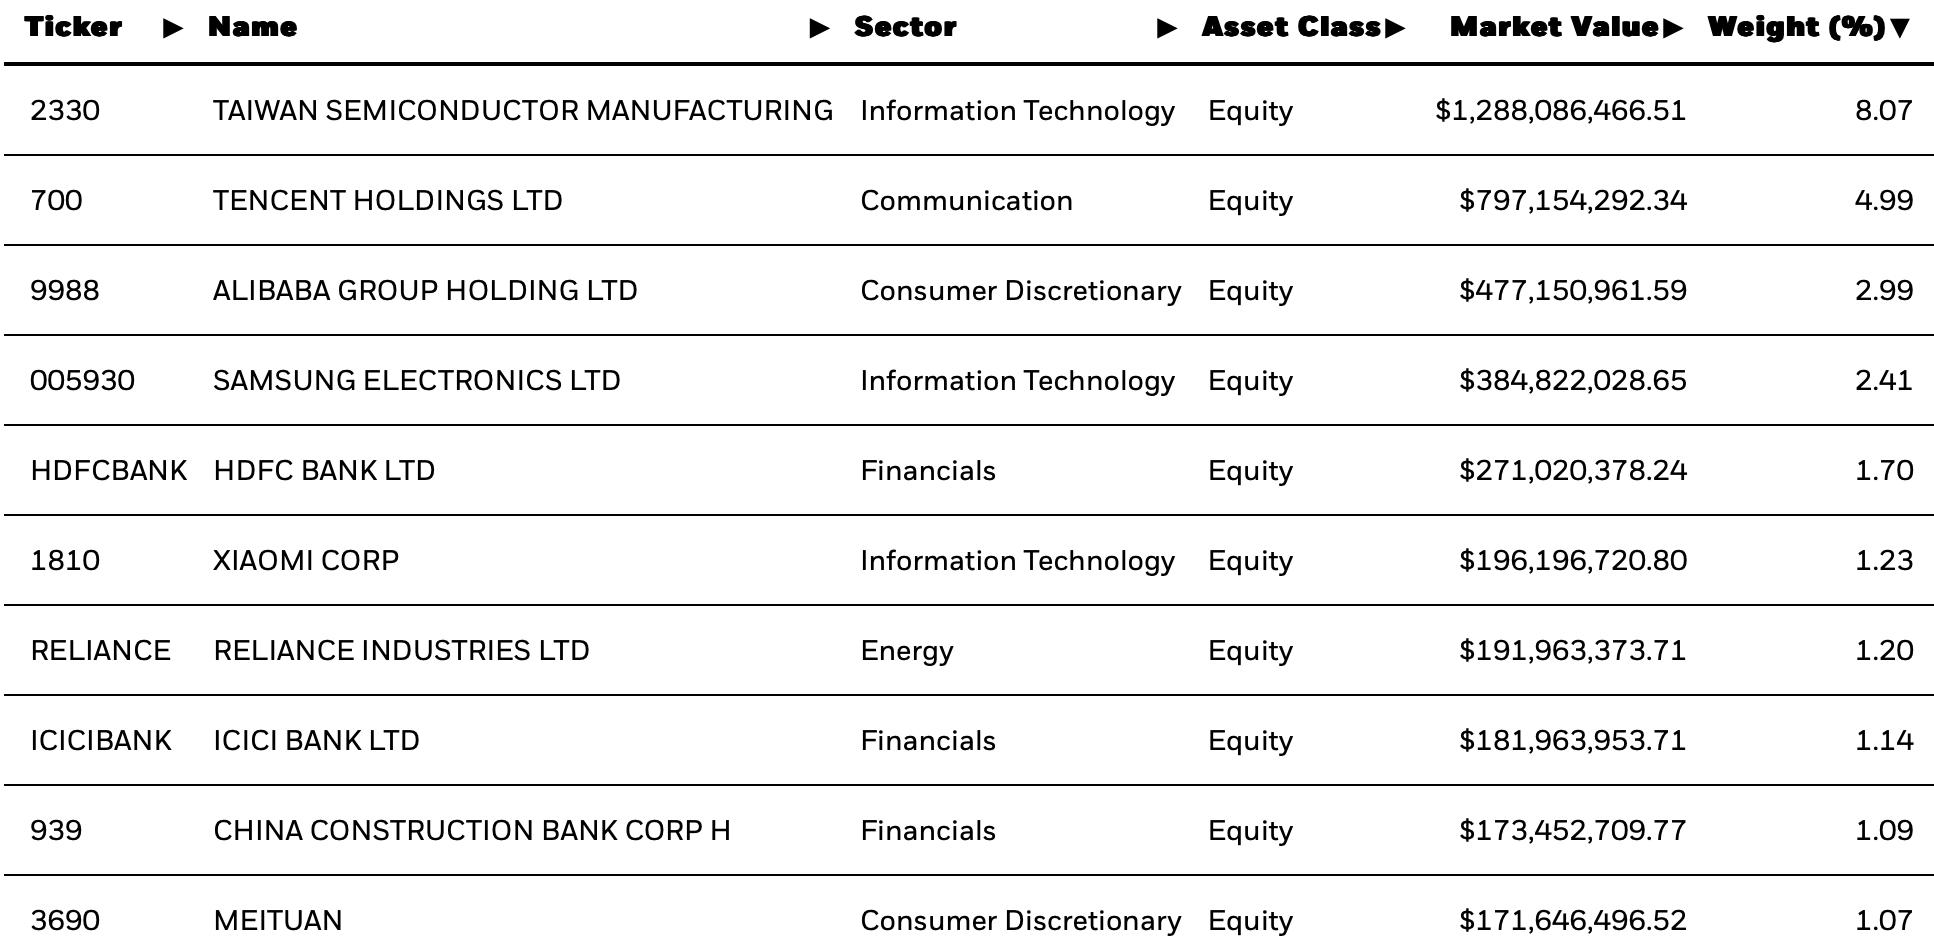
iShares MSCI Emerging Markets ETF (EEM)
EARNINGS: N/A
EEM tracks an index of emerging-market firms weighted by market cap. Click HERE for more information.
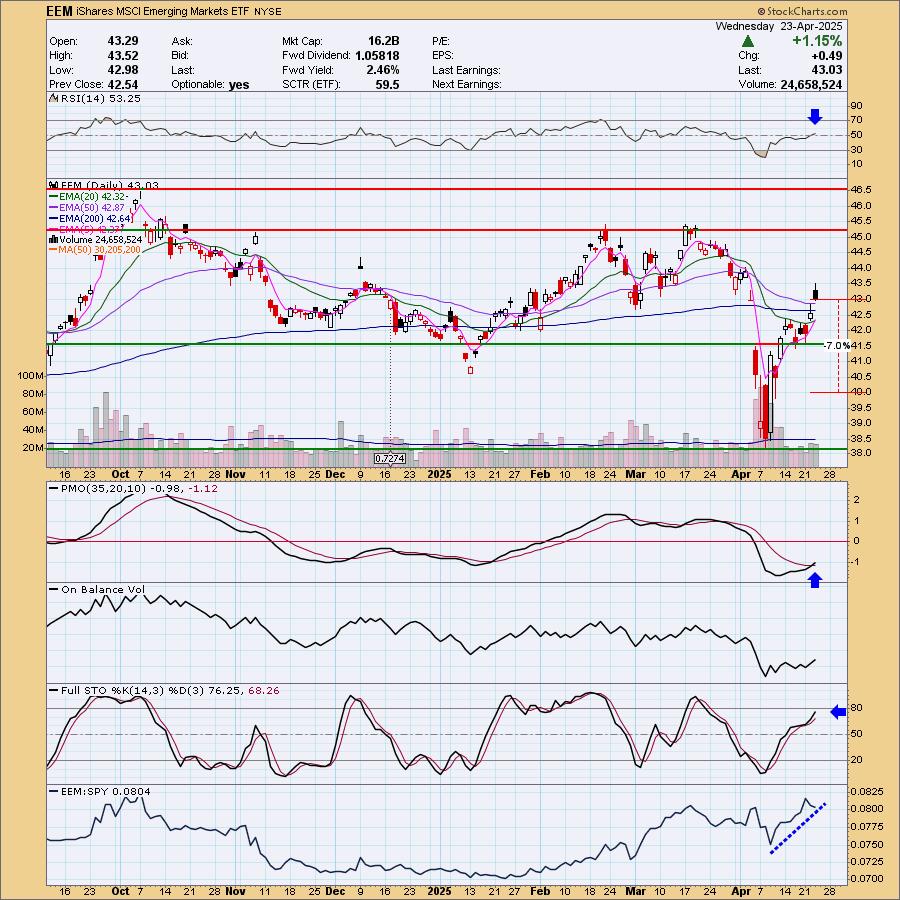
Predefined Scans Triggered: Filled Black Candles and Entered Ichimoku Cloud.
EEM is up +1.00% in after hours trading. I like that the initial gap has now been closed. I also liked that price fully traded above the 50-day EMA today. This does look a lot like a "V" Bottom and those usually lead to extended rallies that take you above the left side of the "V". The RSI just moved into positive territory and the PMO is on a new Crossover BUY Signal. I also like that Stochastics are rising toward 80. Relative strength is also working for EEM. It has been outperforming the SPY on its way up. The stop is set below the January low at 7% or $40.01.
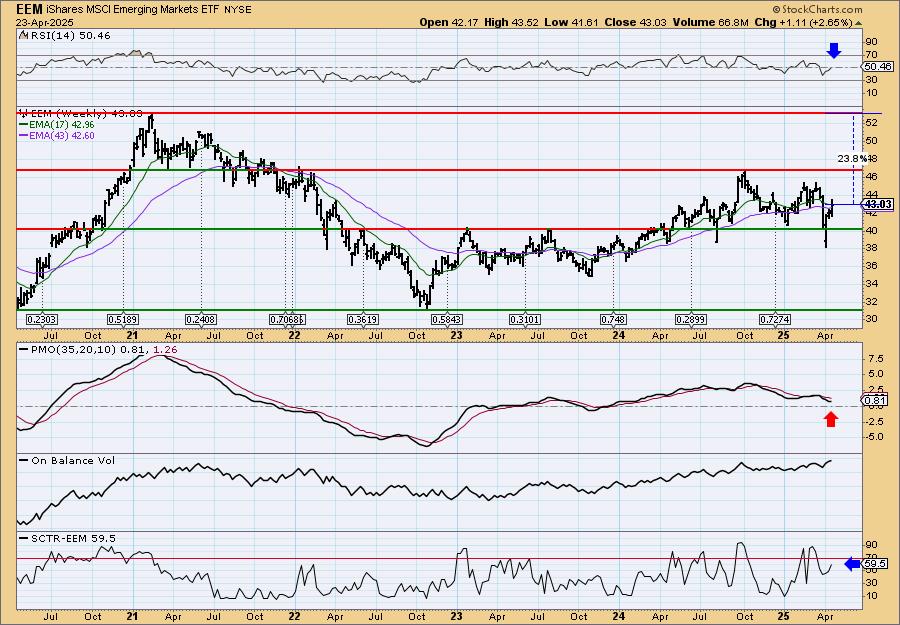
The weekly chart is alright, but I'd prefer to see a breakout from the current trading range. The weekly RSI did just enter positive territory, but the weekly PMO is still headed lower. The StockCharts Technical Rank (SCTR) is not quite in the hot zone* but it is headed there right now. Notice the rising trend on both the OBV and SCTR which are in a positive divergence with price lows.
*If a stock is in the "hot zone" above 70, it implies that it is stronger than 70% of its universe (large-, mid-, small-caps and ETFs) primarily in the intermediate to long terms.
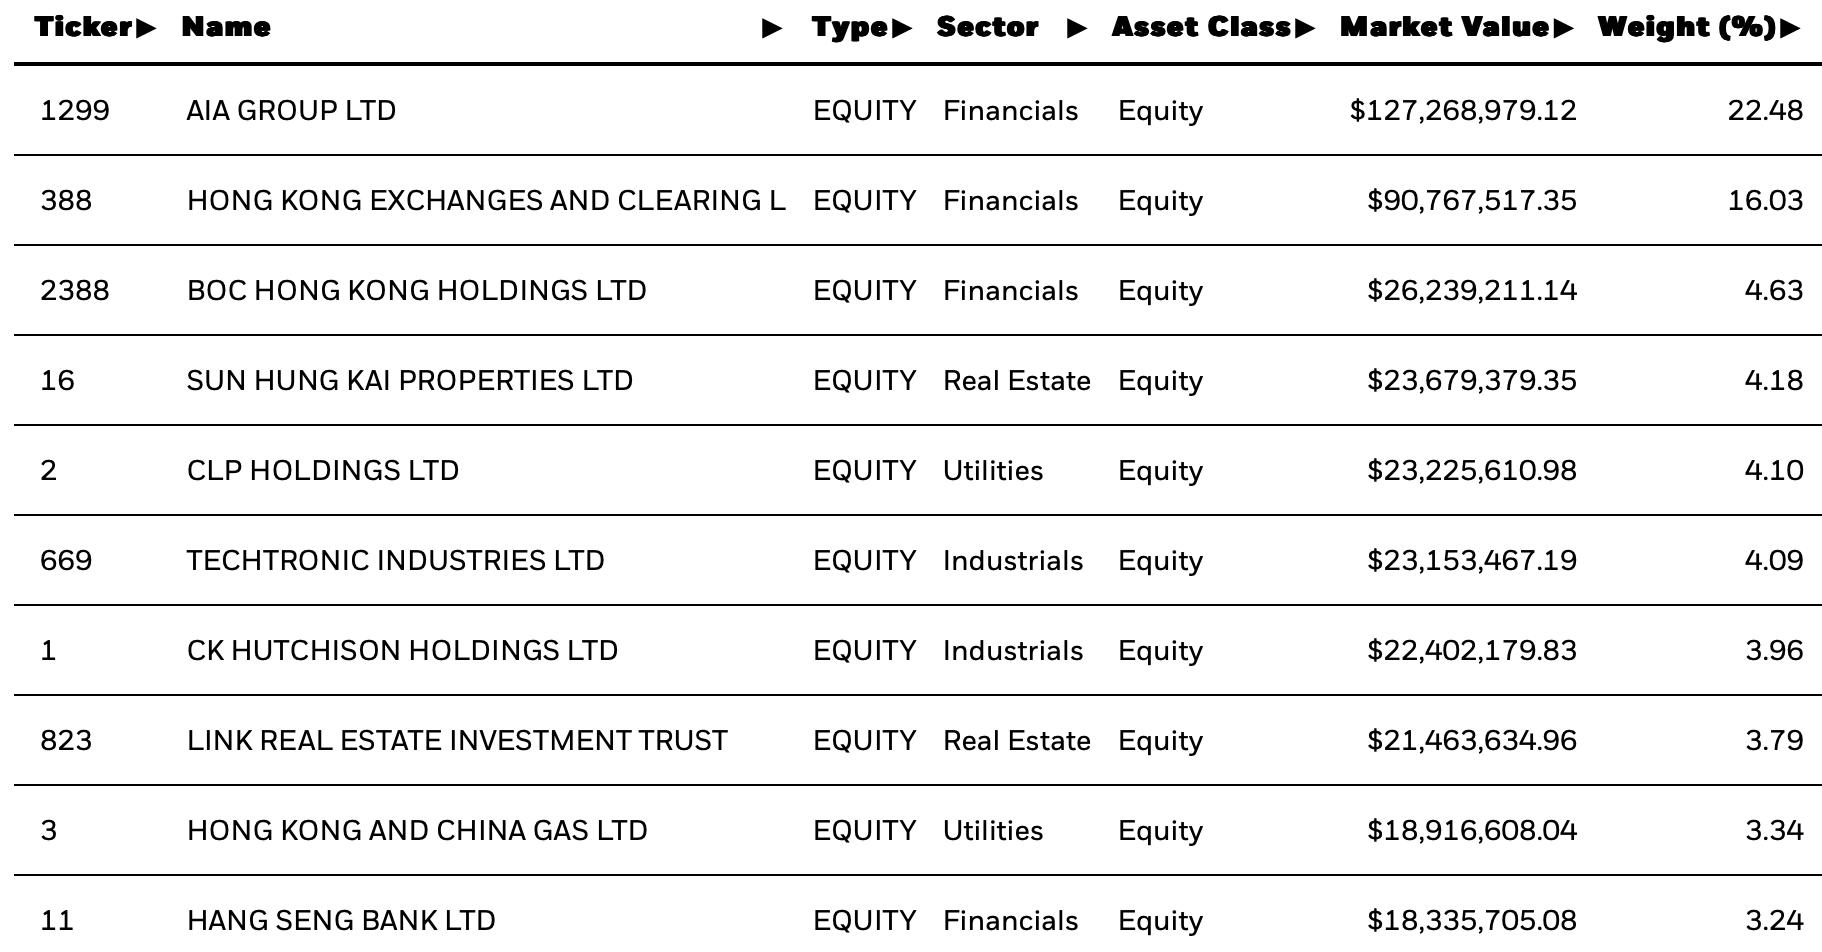
iShares MSCI Hong Kong ETF (EWH)
EARNINGS: N/A
EWH tracks a modified market-cap-weighted index of firms listed on the Hong Kong Stock Exchange. Click HERE for more information.
Predefined Scans Triggered: Filled Black Candles.
EWH is up +1.99% in after hours trading. This one also looks like a possible "V" Bottom formation that implies far more upside. The gap hasn't quite been closed yet, but it did trade completely above the 50-day EMA today. The RSI just moved into positive territory and the PMO is nearing a Crossover BUY Signal. On Balance Volume is confirming the rally as it is in a rising trend. Stochastics are rising nicely toward 80. Relative strength is rising as we want. The stop is set beneath the February low at 7% or $15.88.
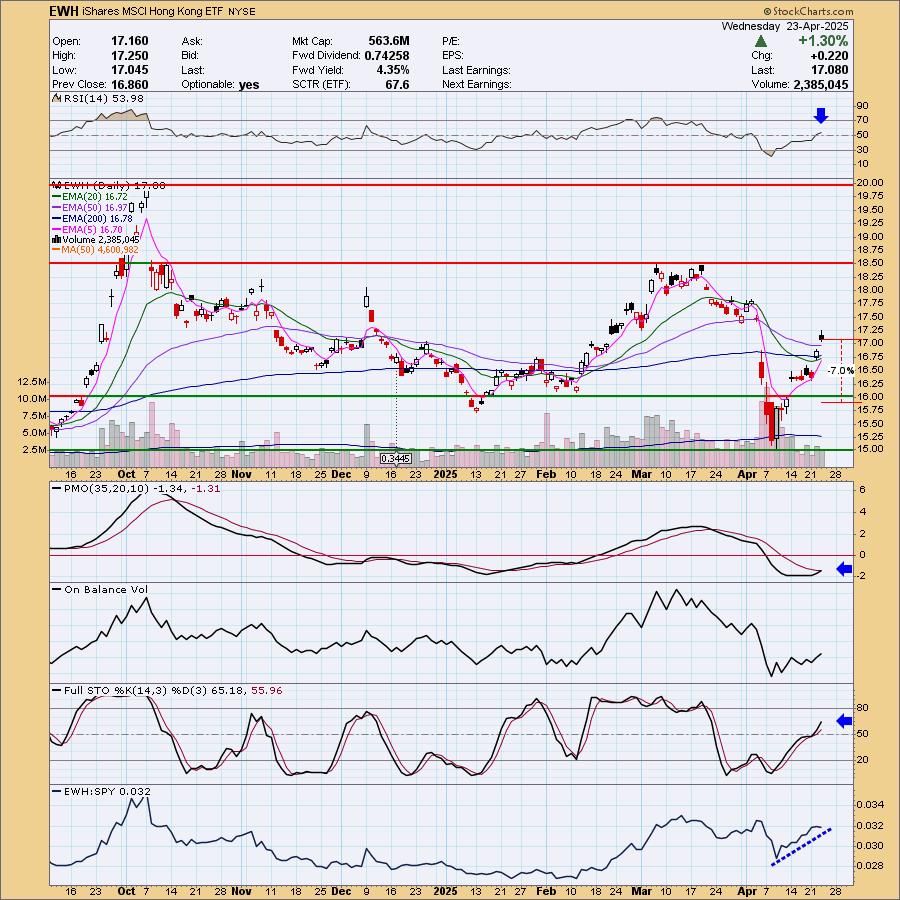
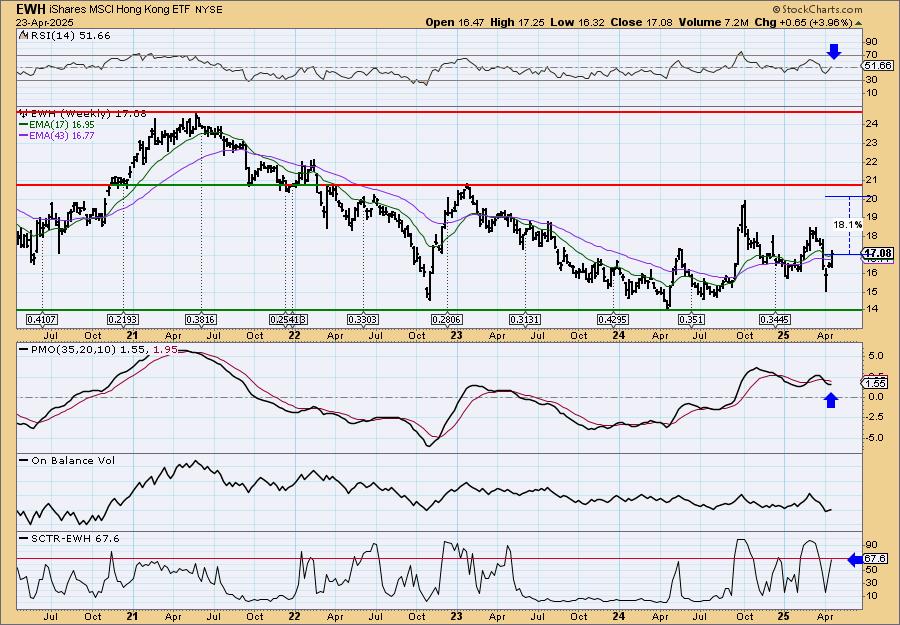
It is in a large trading range right now. We are counting on it getting back to the top of the range. The weekly RSI just moved into positive territory. The weekly PMO is beginning to decelerate its decline. The SCTR is very close to the hot zone above 70. It would be a nice 18% gain if it can reach the 2024 high.
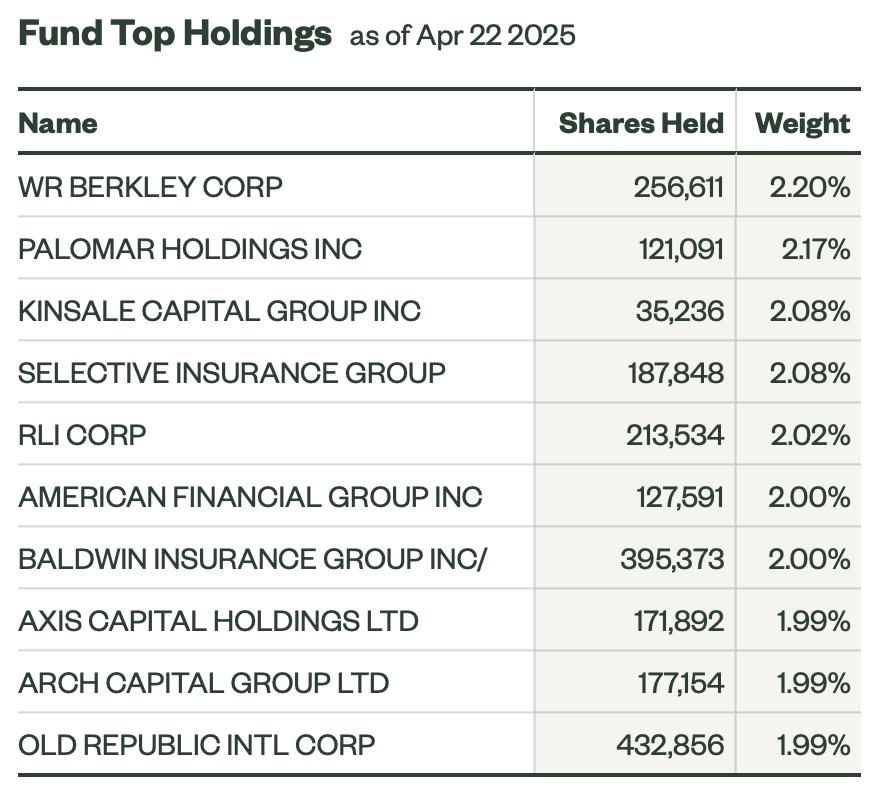
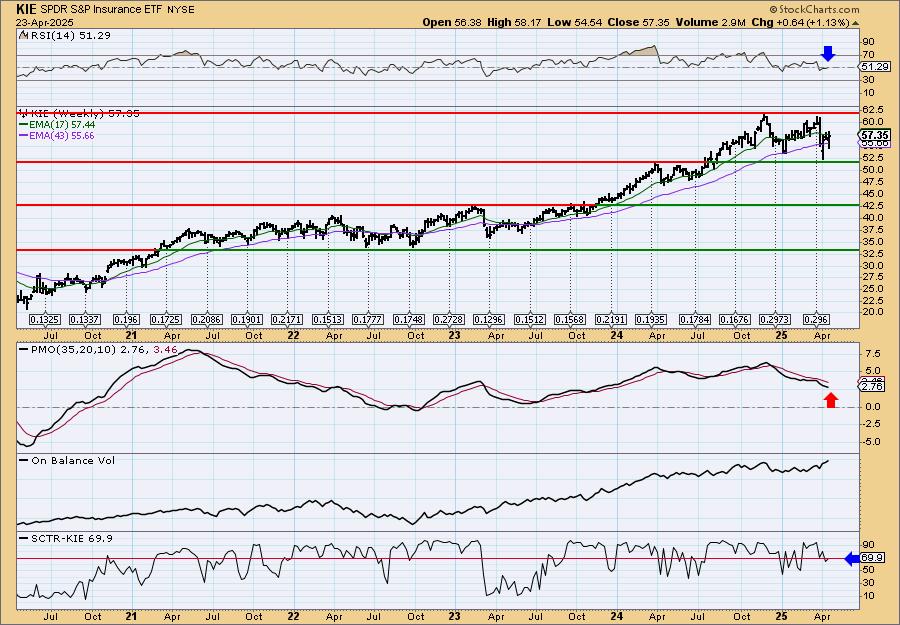
SPDR S&P Insurance ETF (KIE)
EARNINGS: N/A
KIE tracks an equal-weighted-index of insurance companies, as defined by GICS. Click HERE for more information.
Predefined Scans Triggered: Filled Black Candles, Parabolic SAR Buy Signals and Entered Ichimoku Cloud.
KIE is up +1.17% in after hours trading. No "V" Bottom here. It looks very much like the SPY right now so admittedly upside potential may be somewhat limited if the bear market kicks back into gear. You'll want to be nimble. Price is still beneath gap resistance, but I like how the indicators are shaping up. The RSI is negative, but it is very close to positive territory and it is rising and trending higher. The PMO has turned back up and is headed for a Crossover BUY Signal. Stochastics have reversed and are headed higher again. Relative strength is holding up for now. This is probably the most risky of today's selections due to its similarity to the SPY now. The stop is set beneath the January low at 7.1% or $53.27.
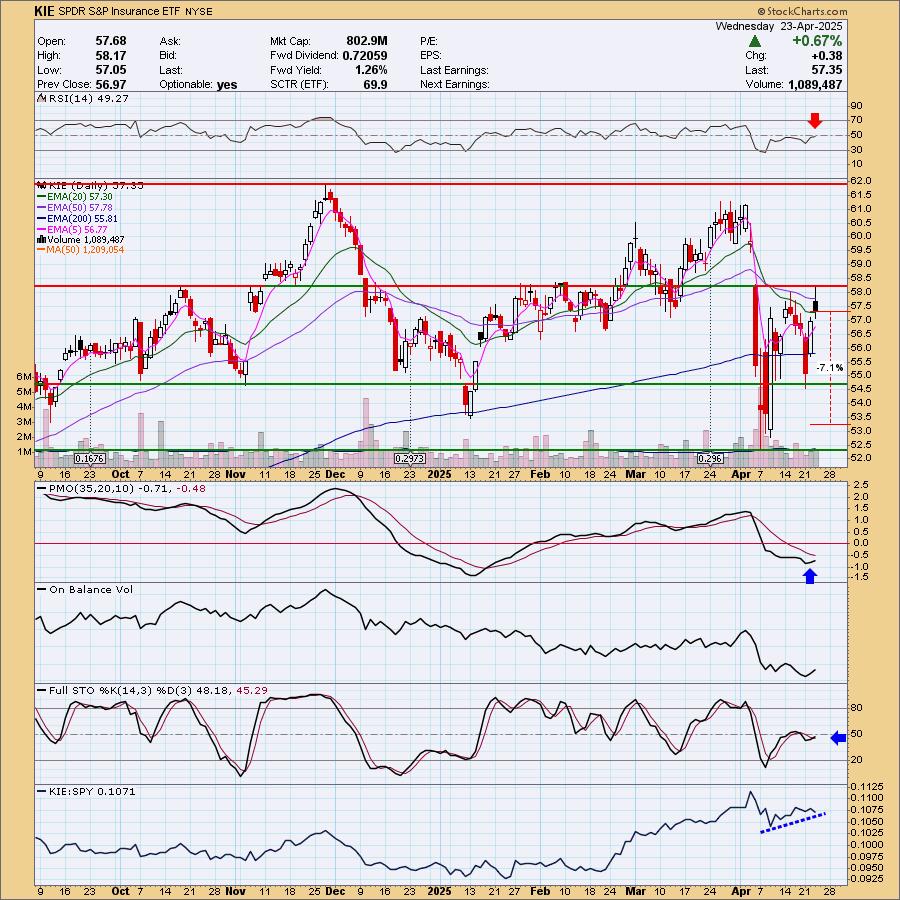
Price is in a trading range on the weekly chart. It appears ready to test the top of the range now. The weekly RSI just entered positive territory and the SCTR is nearly in the hot zone. We have a rising trend on OBV bottoms which is a positive divergence against declining price bottoms. The weekly PMO is a problem, but it has decelerated somewhat. Consider a 17% upside target to about $67.10.
Don't forget, on Thursdays I look at reader-requested symbols, click HERE to send me an email. I read every email I receive and try to answer them all!
Current Market Outlook:
Market Environment: It is important to consider the odds for success by assessing the market tides. The following chart uses different methodologies for objectively showing the depth and trend of participation for intermediate- and long-term time frames.
- The Silver Cross Index (SCI) shows the percentage of SPX stocks on IT Trend Model BUY signals (20-EMA > 50-EMA)
- The Golden Cross Index (GCI) shows the percentage of SPX stocks on LT Trend Model BUY signals (50-EMA > 200-EMA)
Don't forget that as a "Diamonds" member, you have access to our "Under the Hood" curated ChartList on DecisionPoint.com. You'll find it under "Members Only" links on the left side on the Blogs and Links Page.
Here is the current chart:
Full Disclosure: I am 10% long, 0% short.
I'm required to disclose if I currently own a stock I mention and/or may buy/short it within the next 72 hours.
"Technical Analysis is a windsock, not a crystal ball." - Carl Swenlin
(c) Copyright 2025 DecisionPoint.com
Watch the latest episode of DecisionPoint Trading Room with Carl Swenlin & Erin Swenlin Mondays on the DecisionPoint YouTube channel here!
NOTE: The stocks reported herein are from mechanical trading model scans that are based upon moving average relationships, momentum and volume. DecisionPoint analysis is then applied to get five selections from the scans. The selections given should prompt readers to do a chart review using their own analysis process. This letter is not a call for a specific action to buy, sell or short any of the stocks provided. There are NO sure things or guaranteed returns on the daily selection of "Diamonds in the Rough."
Regarding BUY/SELL Signals: The signal status reported herein is based upon mechanical trading model signals and crossovers. They define the implied bias of the price index/stock based upon moving average relationships and momentum, but they do not necessarily call for a specific action. They are information flags that should prompt chart review. Further, they do not call for continuous buying or selling during the life of the signal. For example, a BUY signal will probably (but not necessarily) return the best results if action is taken soon after the signal is generated. Additional opportunities for buying may be found as price zigzags higher, but the trader must look for optimum entry points. Conversely, exit points to preserve gains (or minimize losses) may be evident before the model mechanically closes the signal.
Helpful DecisionPoint Links:
Price Momentum Oscillator (PMO)
Swenlin Trading Oscillators (STO-B and STO-V)
For more links, go to DecisionPoint.com