
It was a true rollercoaster ride this week as the market burst higher on Wednesday with heavy declines Monday, Tuesday and Thursday finishing with a good rally to end the week. Ultimately we believe that the bear market is in force and we should expect lower prices in the intermediate term. You need to be quite nimble to invest in these conditions. No real opportunity for buy and hold longs at this point. Stay alert if you are going to attempt to trade right now.
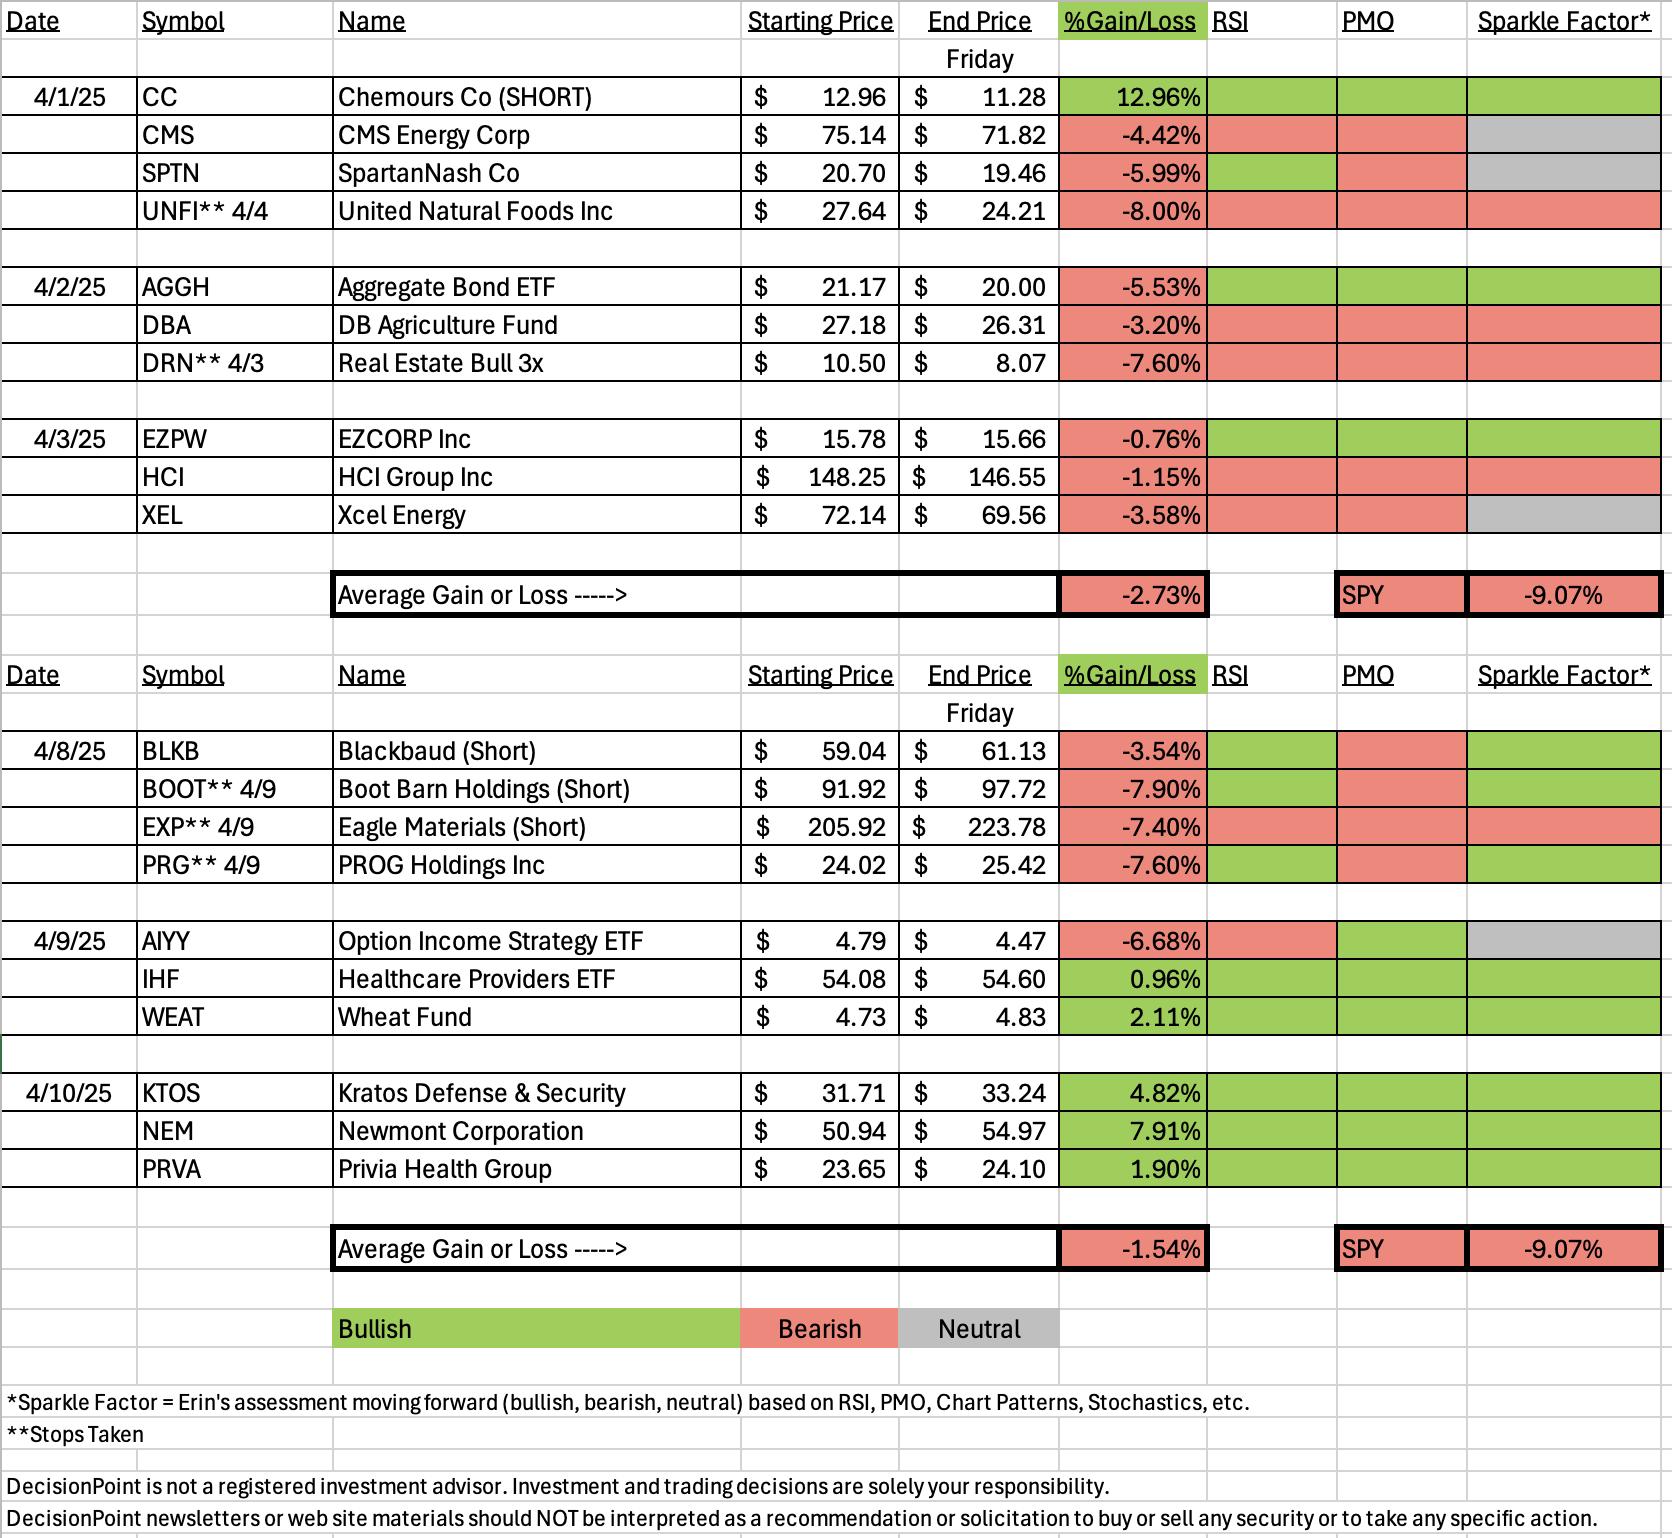
Shorts from Tuesday did not work out with three out of the four hitting their stop levels due to the rally on Wednesday. Most of the shorts look good going forward despite recent rallies. Note the Sparkle Factors on each position for my thoughts on whether the position is still viable or something you could still buy into.
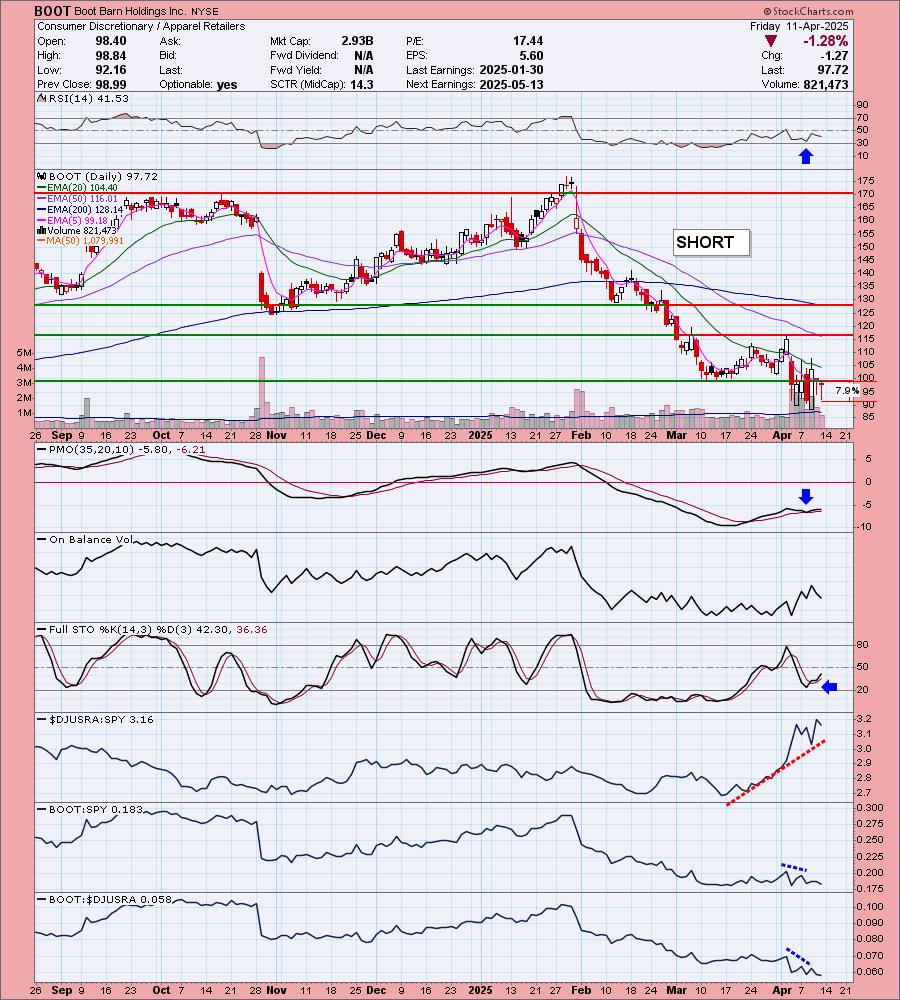
The Dud this week was Boot Barn (short). The stop was rather deep and it was hit so this one wins. However, you'll notice that I'm still bearish on the stock so I think this short could still work out and we're at a better entry point.
The Darling this week is Newmont (NEM), a Gold Miner that soared today. This group looks pretty good moving forward with the strength in Gold. If you don't like this one, you should be able to find another to suit you.
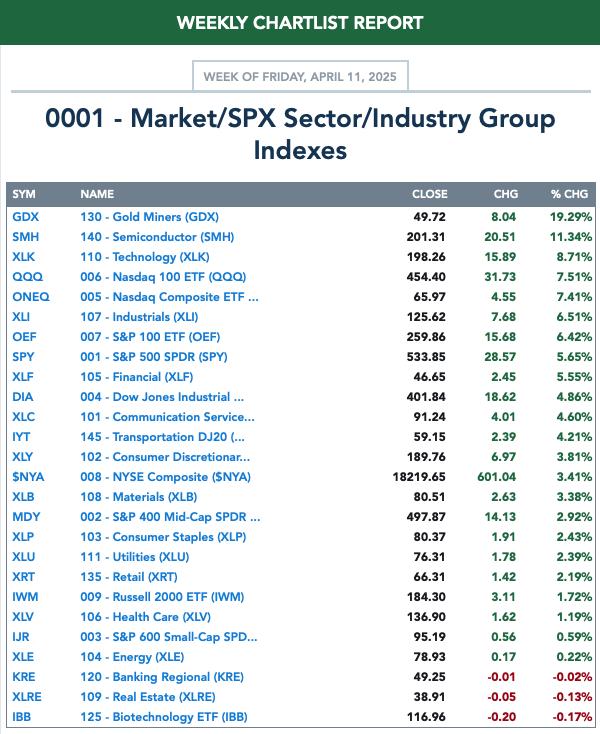
The Sector to Watch had to be Consumer Staples (XLP). Technology (XLK) was actually the runner-up with some interest in Industrials (XLI) as well. Participation was best on XLP and we still think a defensive stance is good in this market environment.
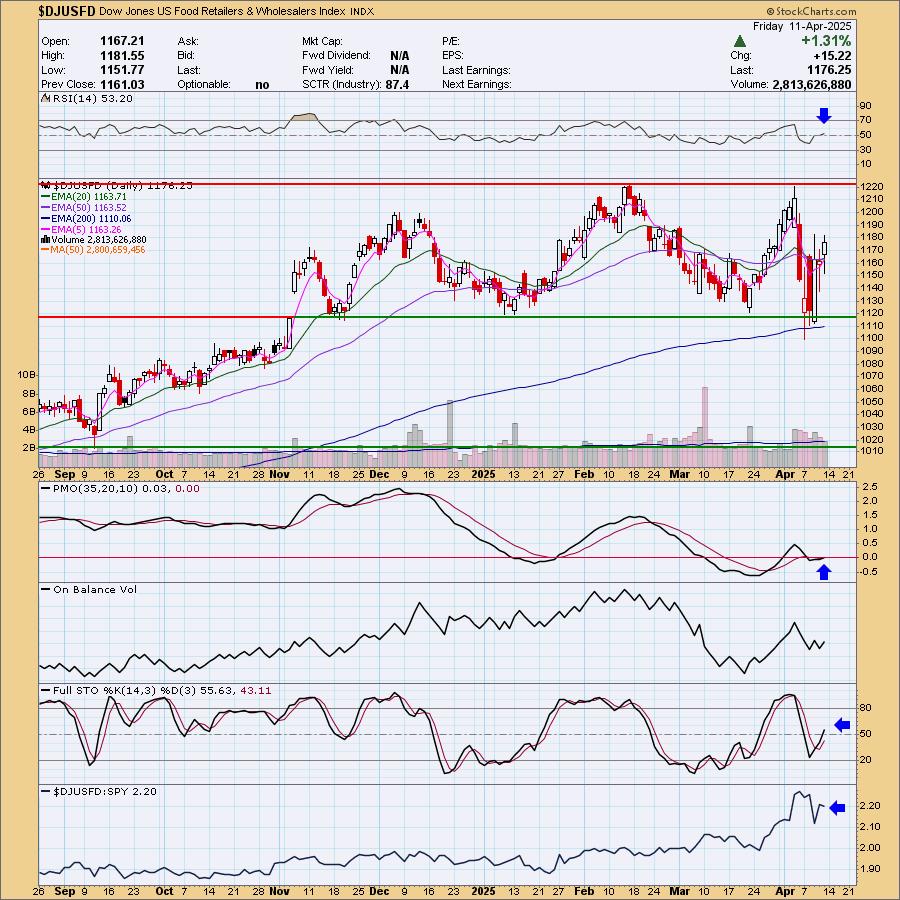
The Industry Group to Watch is Food Retailers. It has some promise and found some good looking stocks within: SFM, NGVC, CASY, KR and GO.
I had time to run some scans at the end of the program. They didn't produce much but we did find the following symbols that look good on the long side: LNTH, ACHC (SHORT), MRCY, SNA, NRG, SDGR and USPH.
We have decided to keep the free DP Trading Room open for awhile longer given market conditions. We'll notify you via email when we go on hiatus.
HEADS UP! Next week there is a Friday holiday so the schedule will be moved up by a day. Four picks on Monday, three ETFs on Tuesday and three Reader Requests on Wednesday with the Diamond Mine trading room on Thursday morning.
Have a wonderful weekend!
Good Luck & Good Trading,
Erin

Diamond Mine Trading Room:
RECORDING & DOWNLOAD LINK (4/11/2025):
Topic: DecisionPoint Diamond Mine (4/11/2025) LIVE Trading Room
Recording & Download Link
Passcode: April#11
REGISTRATION for 4/17/2025:
When: April 17, 2025 09:00 AM Pacific Time (US and Canada)
Topic: DecisionPoint Diamond Mine LIVE Trading Room
Register in advance for this webinar HERE
After registering, you will receive a confirmation email containing information about joining the webinar.

Below is the latest free DecisionPoint Trading Room recording from 4/7/2025. You'll find these recordings posted on Mondays to our DP YouTube Channel. Be sure and subscribe HERE.
A few items about the spreadsheet: I've put on the spreadsheet whether the RSI is positive (green) or negative (red). The PMO column tells you if it is rising (green) or falling (red). Finally I've added my own "Sparkle Factor" that gives you my assessment going forward, bullish (green), bearish (red) or neutral (gray). The Sparkle Factor is basically my thoughts on whether I expect it to rise or fall. A neutral means it could really go either way so it could be added to a watch list. If you're in a stock I consider "neutral" going forward, the ball is in your court.
Darling:
Newmont Corporation (NEM)
EARNINGS: 2025-04-23 (AMC)
Newmont Corp. engages in the exploration and acquisition of gold properties, containing copper, silver, lead, zinc or other metals. It operates through the following geographical segments: Canada, Mexico, Suriname, Argentina, Peru, Australia, Papua New Guinea, Ghana, and U.S. The company was founded by William Boyce Thompson on May 2, 1921 and is headquartered in Denver, CO.
Predefined Scans Triggered: Moved Above Upper Bollinger Band, Moved Above Upper Price Channel, P&F Ascending Triple Top Breakout, New CCI Buy Signals and P&F Double Top Breakout.
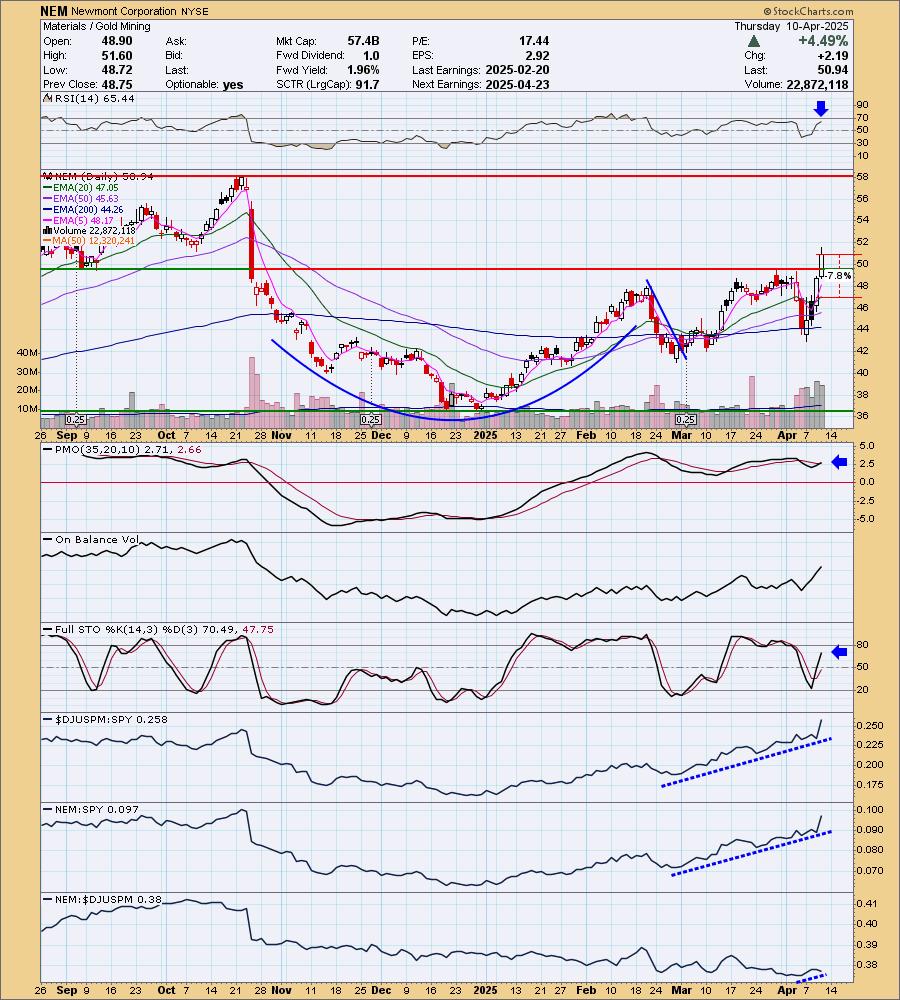
Below are the commentary and chart from Tuesday, 4/10:
"NEM is up +0.26% in after hours trading. Here we do have an official cup with handle pattern that did execute with a rally. Price has broken out above resistance too. The RSI is positive and not yet overbought which is good given this strong rally. The PMO has given us a Crossover BUY Signal above the zero line. Volume is definitely coming in. Stochastics are rising vertically toward 80. The group is clearly outperforming and NEM is taking advantage as it is also outperforming the SPY. It is traveling mostly in line with its group which I'll accept. The stop is set at the 20-day EMA at 7.8% or $46.96."
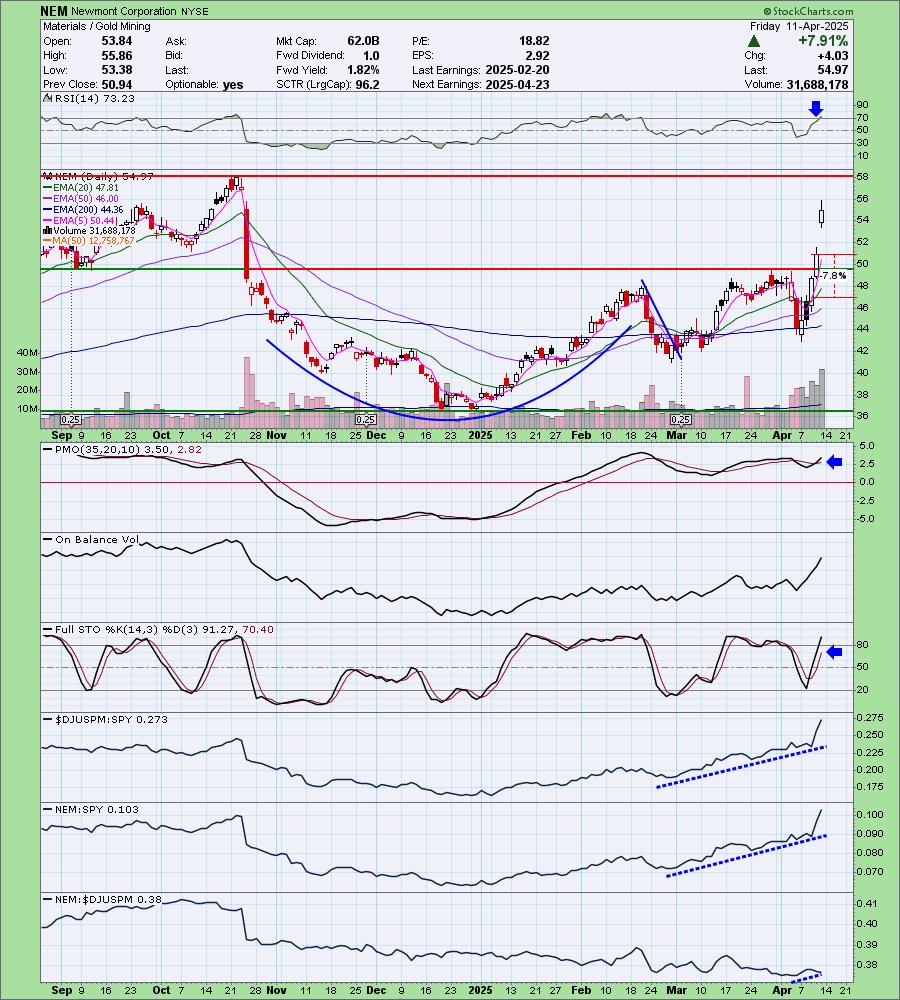
Here is today's chart:
We got the breakout from the cup with handle pattern and it is now off to the races alongside very bullish Gold. I think Gold is getting due for a decline or at least consolidation so this one could cool off at overhead resistance. Still, I think it isn't that bad for entry right now. I would take advantage of any pullback we get, but that may not happen until it hits overhead resistance so there is still more upside ahead.
Don't forget, on Thursdays I look at reader-requested symbols, so shoot me an email at erin@decisionpoint.com. I read every email I receive and try to answer them all!
Dud:
Boot Barn Holdings Inc. (BOOT)
EARNINGS: 2025-05-13 (AMC)
Boot Barn Holdings, Inc. engages in the operation of retail stores of western and work-related footwear, apparel, and accessories. The firm's products include boots, jeans, accessories, hats, gifts and home products, and work wear. Its brands include Ariat, Wrangler, Lucchese Boots, Idyllwind, and Cinch. The company was founded by Kenneth Meany in 1978 and is headquartered in Irvine, CA.
Predefined Scans Triggered: Moved Below Lower Bollinger Band.
Below are the commentary and chart from Tuesday, 4/8:
"BOOT is up +0.84% in after hours trading. I wouldn't be surprised if we do get somewhat of a snapback here after such a large decline, but that will offer a good entry. Today saw a giant bearish engulfing candlestick. Price remains under resistance at the close. The RSI is negative and not oversold. The PMO has topped beneath the zero line and is ready to trigger a Crossover SELL Signal. Stochastics are almost below 20. The group has really been outperforming, but it has done very little to help BOOT. It saw a failed rally. It is already underperforming the group and the SPY. The upside stop is set at 7.8% or $99.09."
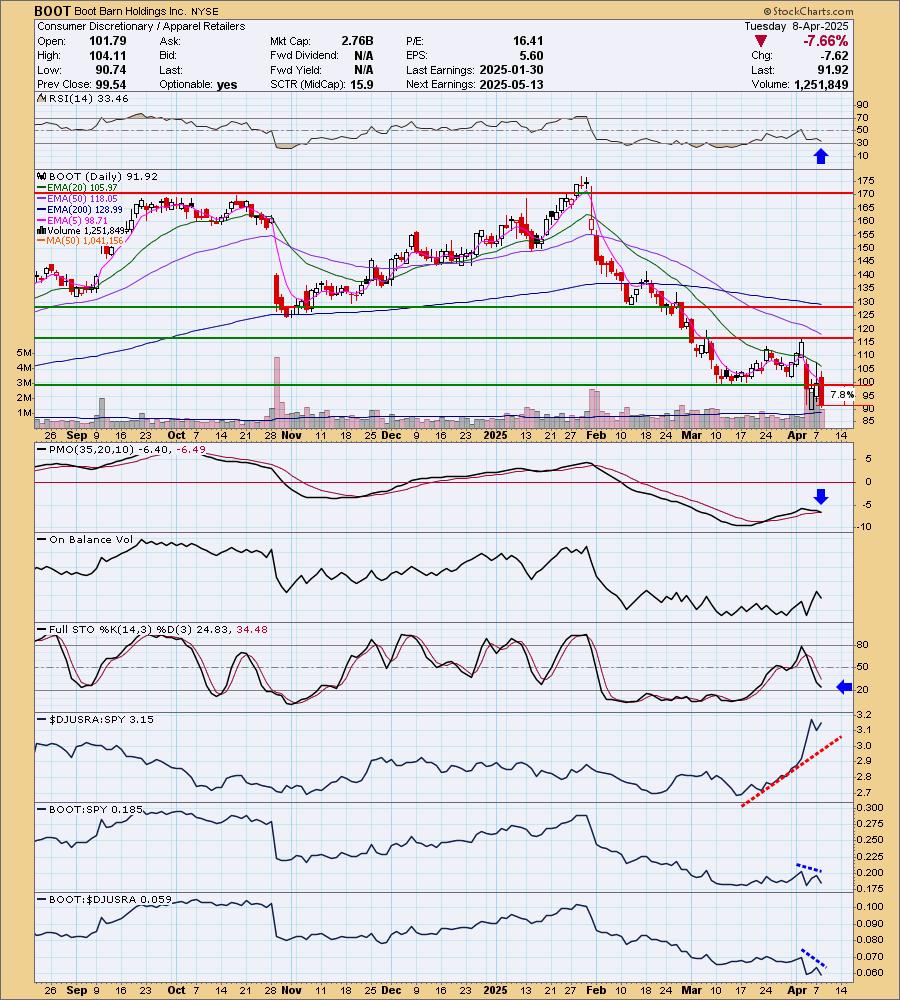
Here is today's chart:
This one got caught in the tsunami that was Wednesday. It leapt higher and closed out the short. I have to say the chart still looks very bearish to me. We have a declining trend that is intact and price is now under support. I think we could see some more downside here.
THIS WEEK's Performance:
DecisionPoint Market Scoreboard (Mechanical Trend Model Signals):

Friday signal changes are outlined in purple.
Click Here to view Carl's annotated "Under the Hood" ChartList!
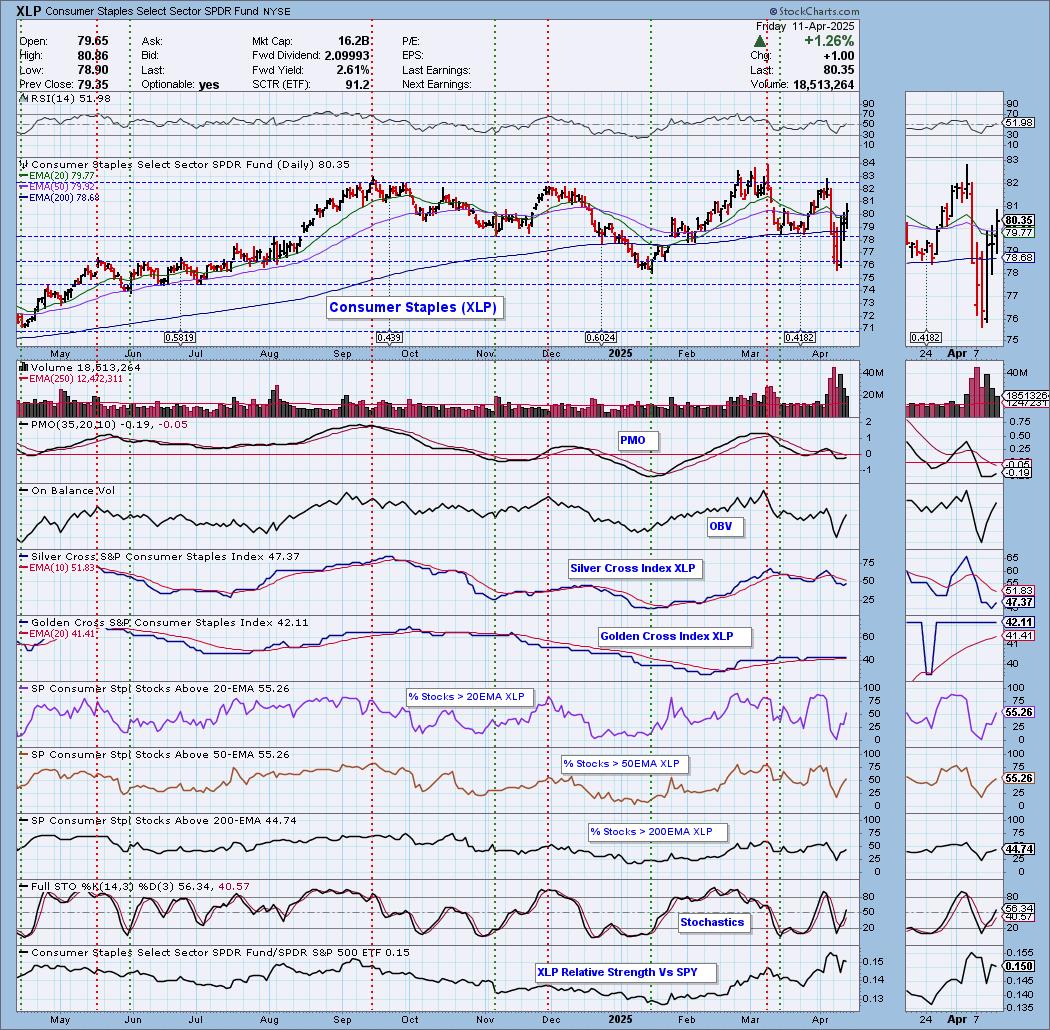
Sector to Watch: Consumer Staples (XLP)
XLP isn't an exciting chart, but it is the healthiest of all that I looked at primarily due to participation and the reversal off support. In fact it didn't have to go down to the support line before turning back up. It is defensive and I think that could serve you well next week. The RSI is now positive and the PMO is rising again. Notice the large amount of volume coming in based on the On Balance Volume (OBV). The Silver Cross Index has turned back up and participation readings are above our bullish 50% threshold as far as stocks above their 20/50-day EMAs. Stochastics are rising in positive territory. Relative Strength is picking up again.
Industry Group to Watch: Food Retailers ($DJUSWU)
Not the most exciting chart I've seen as it is in a trading range right now, but it does seem as though it will test resistance and given the indicators there is a chance for a breakout ahead. The RSI just moved into positive territory and the PMO has risen into positive territory on a new Crossover BUY Signal. Stochastics are rising strongly. A few stocks to consider in this group are: SFM, NGVC, CASY, KR and GO.
Go to our Under the Hood ChartList on DecisionPoint.com to get an in-depth view of all the sectors. On StockCharts.com you can find the Industry Summary.
Good Luck & Good Trading!
- Erin
erin@decisionpoint.com
Full Disclosure: I'm 10% long, 0% short.
Watch the latest episode of the DecisionPoint Trading Room with Carl & Erin Swenlin HERE!
Technical Analysis is a windsock, not a crystal ball. --Carl Swenlin
NOTE: The stocks reported herein are from mechanical trading model scans that are based upon moving average relationships, momentum and volume. DecisionPoint analysis is then applied to get selections from the scans. The selections given should prompt readers to do a chart review using their own analysis process. This letter is not a call for a specific action to buy, sell or short any of the stocks provided. There are NO sure things or guaranteed returns on the selection of "diamonds in the rough."
Helpful DecisionPoint Links:
DecisionPoint Shared ChartList and DecisionPoint Chart Gallery
Price Momentum Oscillator (PMO)
Swenlin Trading Oscillators (STO-B and STO-V)
(c) Copyright 2025 DecisionPoint.com