
The results from today's scans were a mixed bag. However, one theme was very clear when I looked at the various results, the Gold Miners are building momentum after being beat down along with Gold. I wasn't completely happy with the Miners that were presented to me in the scan results so I went into the Industry Group Summary on StockCharts and ordered it by the StockCharts Technical Ranking (SCTR) value. The Gold Miner I'm going to present was at the top of that list. My thinking is that if that group is on its way back up, I want in, but I like the idea of picking a stock that didn't get beat down in the first place. I think you can pick your favorite Miner at this point, but I thought I would present the stand out Gold Miner based on its strong SCTR.
The others are names you will recognize. Semiconductors are turning it around and I have two that I'm presenting. Software has been on a tear and Semiconductors have been left behind. It is likely time for Software to hand the torch back to the Semis.
For my new subscribers from Cyber Monday, welcome to the Diamond community! I want to reiterate that the purpose of this report is to give you stock ideas. I only track them for one week, so this is not a model portfolio. I am not expecting you to buy when it is in the Report and then sell on Friday. My job is to teach you how to identify positive charts and determine stops and targets. I do my recap on Friday to take stock (no pun intended) of the Diamonds for the past week and see where they are currently and then give my impression going forward (the "Sparkle Factor"). The DP Alert gives you the overall market conditions for the SPY, Dollar, Gold, Oil, Gold Miners and Bonds. It sets the back drop for Diamonds.
Today's "Diamonds in the Rough" are: NVDA, PTON, SBSW, SWKS and TMO.
 Diamond Mine Information:
Here is Friday's (11/20) recording link. Use Access Passcode: @f#x+6qP
Register in advance for the next "DecisionPoint Diamond Mine" trading room on Friday (12/4/2020) 12:00p ET:
Here is the registration link for Friday, 12/4/2020. Password: turkey
Please do not share these links! They are for Diamonds subscribers ONLY!

It's Free!
***Click here to register for this recurring free DecisionPoint Trading Room on Mondays at Noon ET!***
Did you miss the 11/23 free trading room? Here is a link to the recording. Access Code: EE4Xi6Y$
For best results, copy and paste the access code to avoid typos.
Welcome to DecisionPoint Daily Diamonds, wherein I highlight five "diamonds in the rough." These are selected from the results of my DecisionPoint scans, which search for stocks that could benefit from the trend and condition of the market. Remember, these are not recommendations to buy or sell, but are the most interesting of the stocks that surfaced in my scans. My objective is to save you the work of the initial, tedious culling process, but you need to apply your own analysis to see if these stocks pique your interest as well. There are no guaranteed winners here!
NVIDIA Corp. (NVDA)
EARNINGS: 2/17/2021 (AMC)
NVIDIA Corp. engages in the design and manufacture of computer graphics processors, chipsets, and related multimedia software. It operates through the Graphics Processing Unit (GPU) and Tegra Processor segments. The GPU segment comprises of product brands, which aims specialized markets including GeForce for gamers; Quadro for designers; Tesla and DGX for AI data scientists and big data researchers; and GRID for cloud-based visual computing users. The Tegra Processor segment integrates an entire computer onto a single chip, and incorporates GPUs and multi-core CPUs to drive supercomputing for autonomous robots, drones, and cars, as well as for consoles and mobile gaming and entertainment devices. The company was founded by Jen-Hsun Huang, Chris A. Malachowsky, and Curtis R. Priem in January 1993 and is headquartered in Santa Clara, CA.
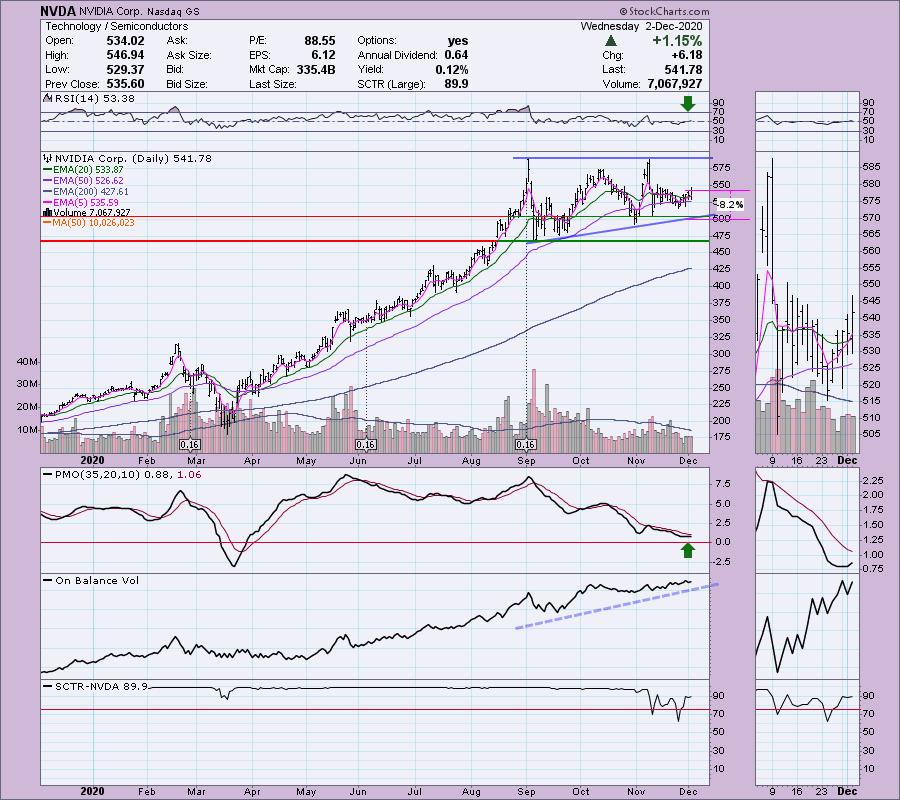
This is Semiconductor #1: NVDA has been covered twice before in Diamonds. I covered it in the March 3rd Diamond Report (up 103% since then) and in the April 7th Diamond Report (up 109% since then). I hate to take too much credit here, it wasn't too tough to find a winner coming out of the bear market low, but this one left that bear market in the dust and until this quarter was on a steady rise. I see a bullish ascending triangle and price bottoming before having to test the rising bottoms trendline that forms the bottom of the triangle. It's bouncing off the 50-EMA. The 5-EMA just had a positive crossover the 20-EMA which gives us a DP Short-Term Trend Model BUY signal. The RSI has been mostly neutral, but it is back in positive territory right now. I always like a PMO bottom that scoops like this. The momentum is building slowly but surely. The OBV is confirming the rally and the SCTR is very strong.
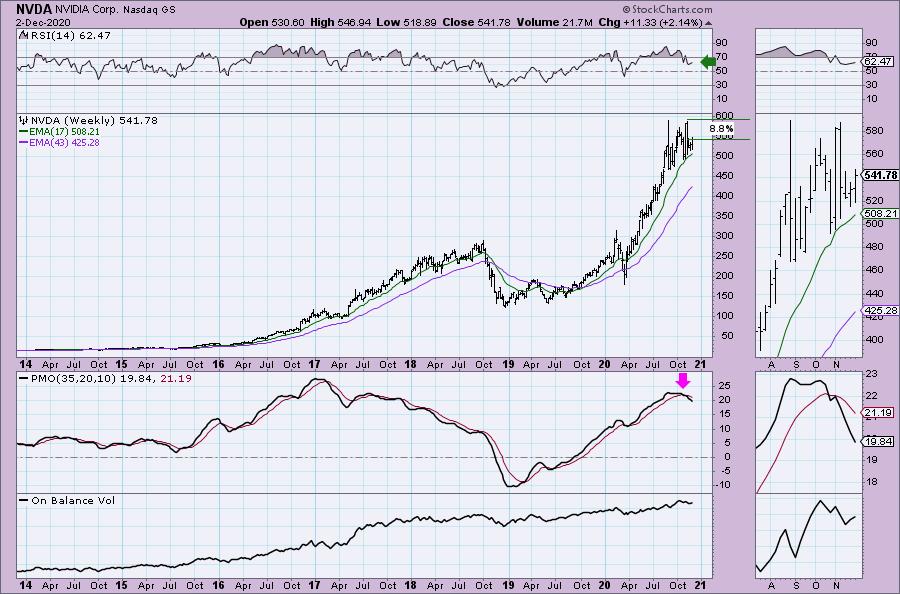
The weekly chart could be better. The PMO is on a SELL signal. However the RSI is positive and the OBV continues to confirm this year's rally by steadily rising with price. Consider it a short-term investment that you should keep a watchful eye on.
Peloton Interactive Inc. (PTON)
EARNINGS: 2/3/2021 (AMC)
Peloton Interactive, Inc. operates at-home fitness platform for live and on-demand indoor cycling classes. The company pioneered connected, technology-enabled fitness, and the streaming of immersive, instructor-led boutique classes for its Members. It operates through three reportable segments: Connected Fitness Products, Subscription and Other. The Connected Fitness Product segment consists of sales of bike, tread & related accessories. The Subscription segment involves in the monthly subscription and credits from live studio classes. The Other segment consists of boutique and apparel sales. The Peloton Interactive was founded on by John Foley, Graham Stanton, Thomas Cortese, Yony Feng and Hisao Kushi in 2012 and is headquartered in New York, NY.
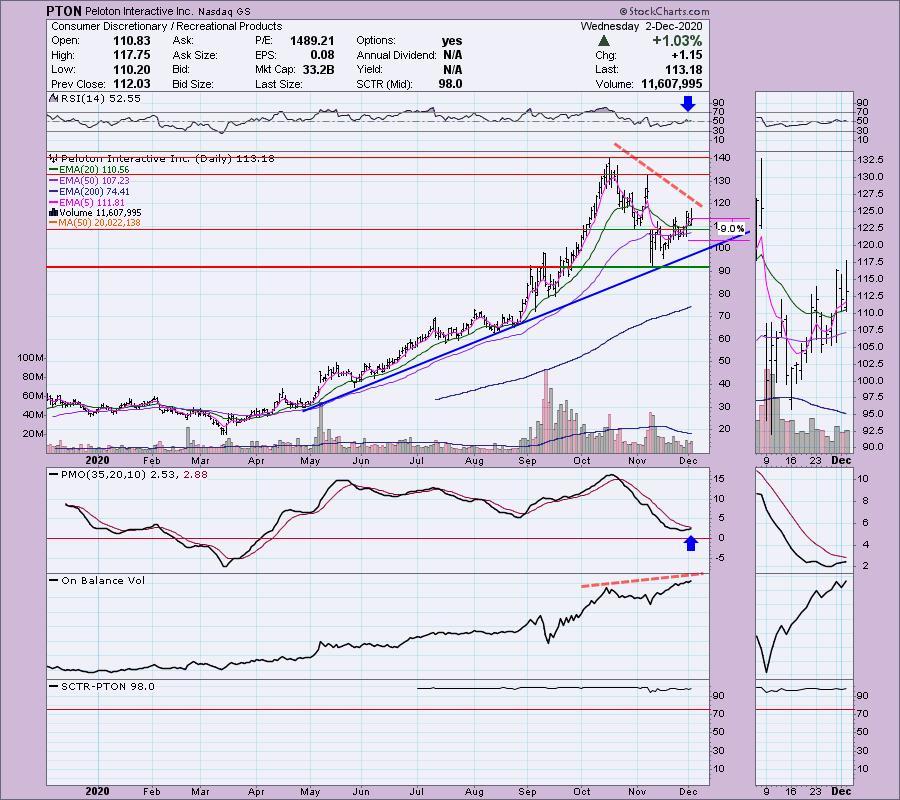
I'm still bullish on the Consumer Discretionary (XLY) sector, especially going into the holidays. I covered PTON in the April 2nd Diamonds Report (it's up 323% since then). I didn't buy it, but I sure wish I had. It's not been a great stock this quarter, but it is time for a breakout. I don't think the Peloton craze is over yet. It has avoided a 20/50-EMA negative crossover and price is now holding above the 20-EMA. It hasn't broken its declining trend but given the rising PMO and rising RSI that is in positive territory, I am expecting that breakout. I am somewhat concerned about the 'reverse' divergence between OBV tops and price tops. When the OBV makes a higher high, you want to see price do the same. When it doesn't it tells us that price isn't following volume like it should. If you pour in positive volume, you should see price rise. The SCTR is outstanding at 98.0 so despite that OBV technical issue, I like PTON.
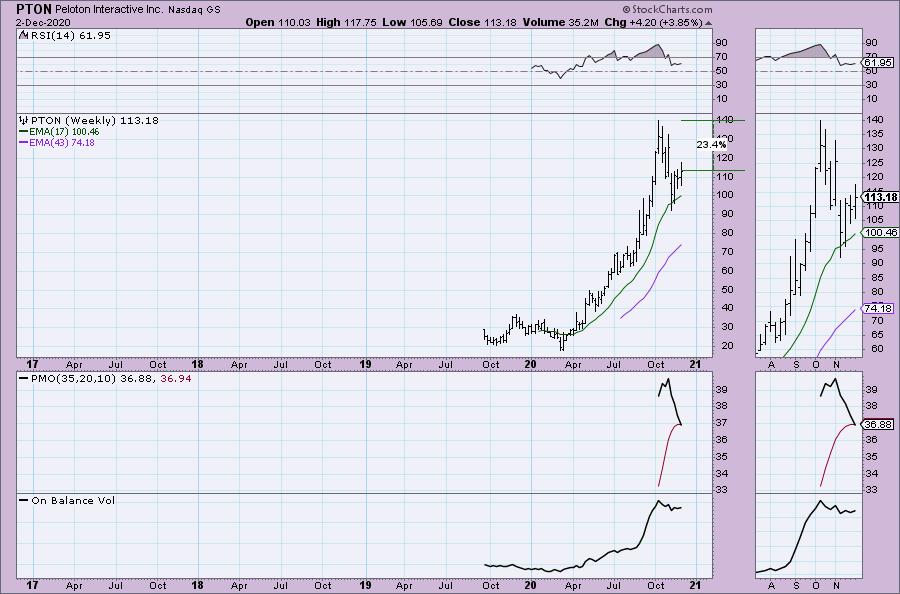
Given we don't have much more information on the weekly chart as it is all mostly on the daily chart, I won't really analyze the weekly here. I do note that the RSI is positive. I can't put emphasis on this PMO because there simply isn't enough data. We do see that this pullback has left room now for a price rise of 23%. That's doable.
Don't forget, on Thursdays I look at reader-requested symbols, so shoot me an email at erin@decisionpoint.com. I read every email I receive and try to answer them all!
Sibanye Stillwater Ltd (SBSW)
EARNINGS: 2/18/2021
Sibanye Stillwater Ltd. engages in the provision of precious metals mining services. Its portfolio includes the platinum group metal (PGM) operations in the United States, South Africa, and Zimbabwe; gold operations and projects in South Africa; and copper, gold and PGM exploration properties in North and South America. The company was founded on November 7, 2014 and is headquartered in Weltevreden Park, South Africa.
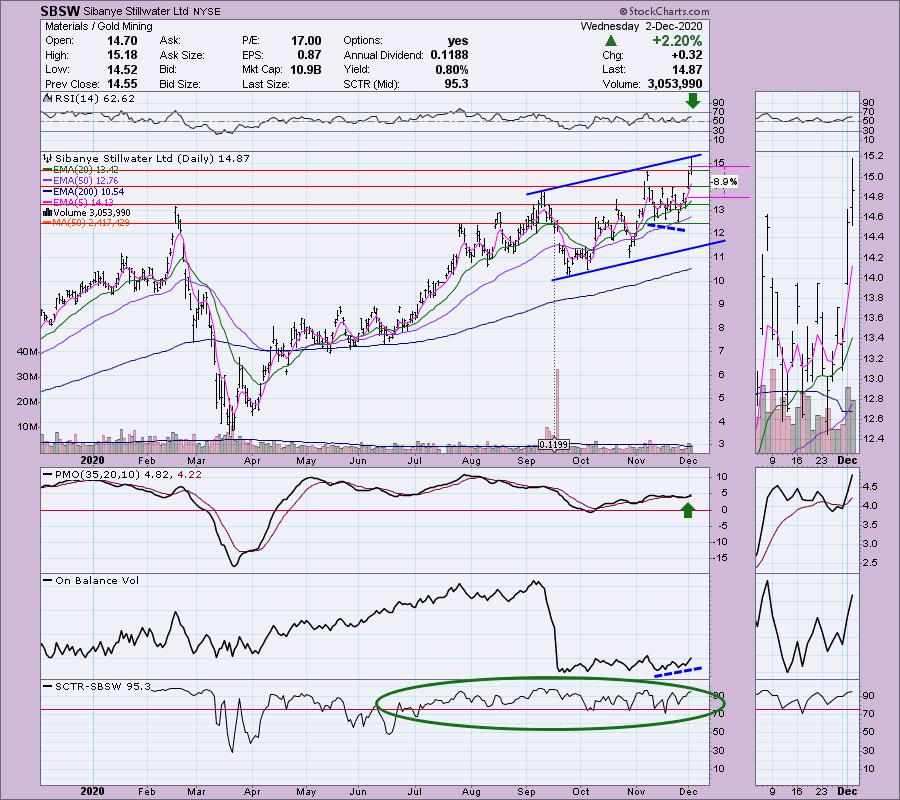
Here is my Miner. I covered SBSW in the August 18th Diamonds Report (it's up 17% since). This is a very different chart in comparison to the majority of the Gold Miner charts. DP Alert readers will recognize that difference right away since we cover GDX daily. Unlike most of the Miners, SBSW is in a rising trend. It did pause and stop during November when most Miners were in decline. It has since broken out. I believe there is a good chance there will be a breakout. Notice that in November, price didn't need to test the bottom of the rising trend channel and in fact consolidated above the 50-EMA. The RSI is positive and the PMO is now on a BUY signal again. There is a small positive divergence with the OBV that led into the current rally as well. The SCTR is top notch and the main reason I'm presenting this one to you.
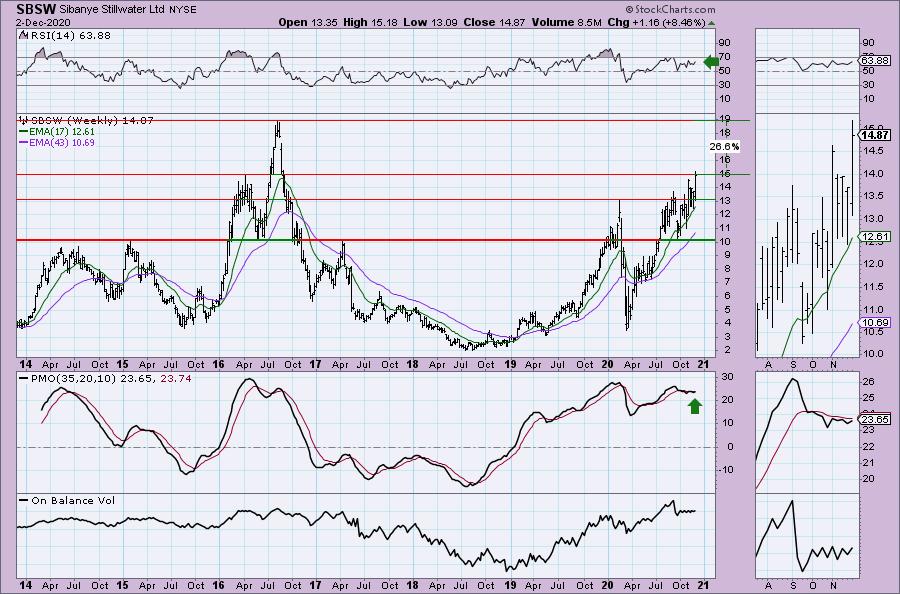
On the daily chart we couldn't see the early 2016 top. It is testing that overhead resistance right now. I am looking for price to rally higher. Not sure we will see 26.6%, but it certainly could given the positive RSI and flat PMO that is working on getting a crossover BUY signal.
Skyworks Solutions Inc. (SWKS)
EARNINGS: 1/21/2021 (AMC)
Skyworks Solutions, Inc. engages in the design, development, and manufacture of proprietary semiconductor products. Its product portfolio includes amplifiers, attenuators, circulators, demodulators, detectors, diodes, directional couplers, front-end modules, hybrids, isolators, lighting and display solutions, mixers, modulators, optocouplers, optoisolators, phase shifters, synthesizers, power dividers and combiners, receivers, switches, and technical ceramics. The company was founded in 1962 and is headquartered in Woburn, MA.
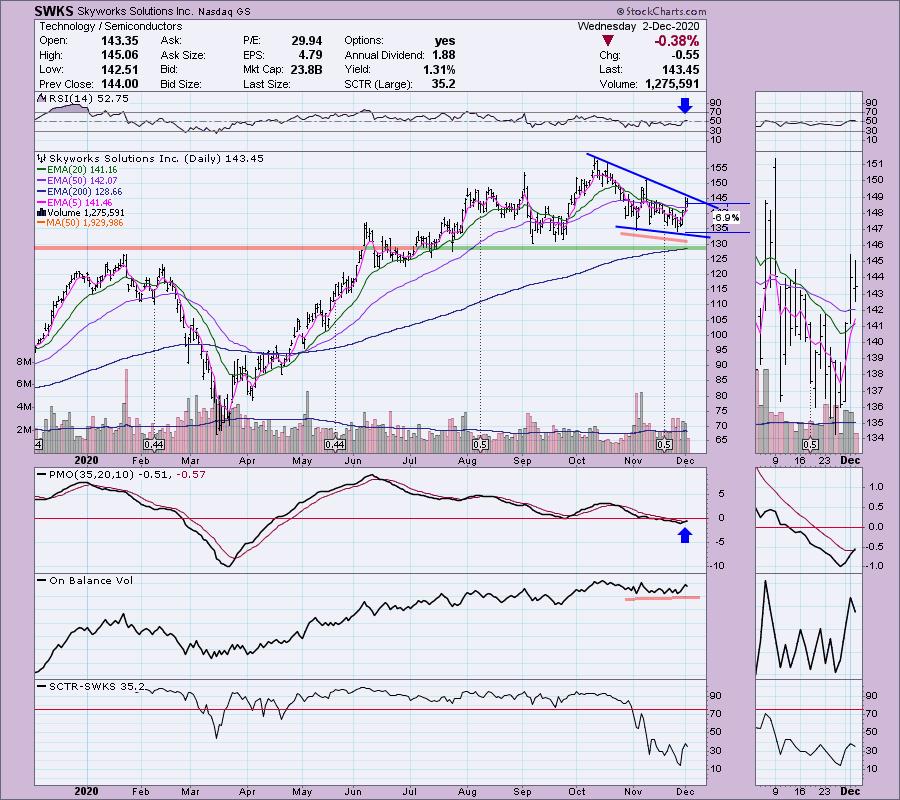
Well here is a Diamond that I haven't covered this year. This is my second Semiconductor. There is a bullish falling wedge and price is getting ready to test the top of it. The expectation for the pattern is an upside breakout. The 5-EMA just crossed above the 20-EMA which triggered a ST Trend Model BUY signal. The RSI just moved into positive territory and the PMO generated a crossover BUY signal today. The stop level is shallow at only 7%. It is lined up with support at that most recent low. There is a slight positive divergence with the OBV that is coming as price is beginning to rally again.
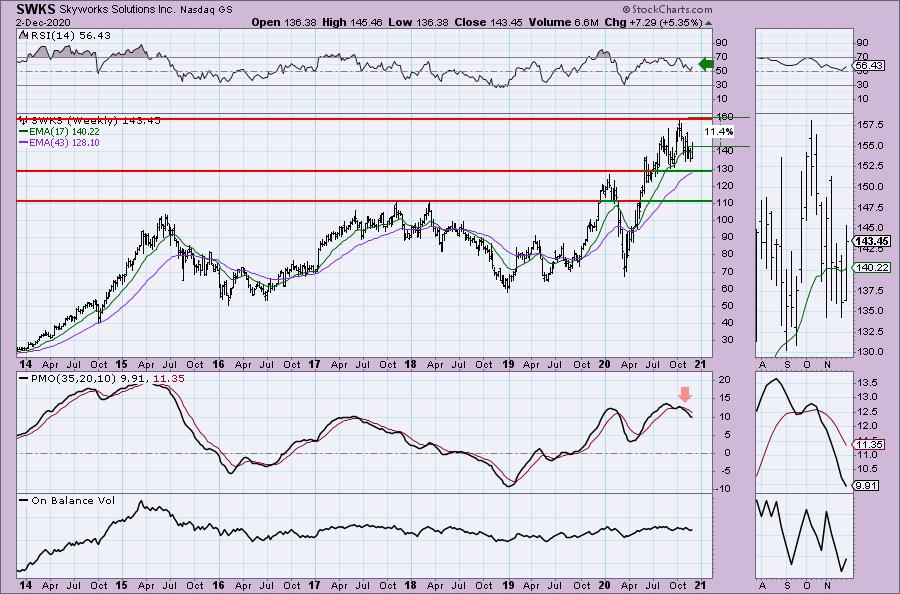
I'm not thrilled with the weekly chart, but our time horizon here is mostly short-term. The RSI is positive, but I don't see a positive OBV divergence here and the PMO is configured negatively. Consider this a short-term trade to begin.
Thermo Fisher Scientific Inc. (TMO)
EARNINGS: 1/28/2021 (BMO)
Thermo Fisher Scientific, Inc. engages in the provision of analytical instruments, equipment, reagents and consumables, software and services for research, analysis, discovery, and diagnostics. It operates through the following segments: Life Sciences Solutions, Analytical Instruments, Specialty Diagnostics, and Laboratory Products and Services. The Life Sciences Solutions segment comprises of portfolio of reagents, instruments, and consumables used in biological and medical research, discovery and production of new drugs, and vaccines as well as diagnosis of disease. The Analytical Instruments segment offers instruments, consumables, software, and services that are used for a range of applications in the laboratory, on the production line, and in the field. The Specialty Diagnostics segment gives diagnostic test kits, reagents, culture media, instruments, and associated products used to increase the speed and accuracy of diagnoses. The Laboratory Products and Services segment involves in providing everything needed for the laboratory, including a combination of self-manufactured and sourced products for customers in research, academic, government, industrial, and healthcare settings. The company was founded on October 11, 1960 and is headquartered in Waltham, MA.
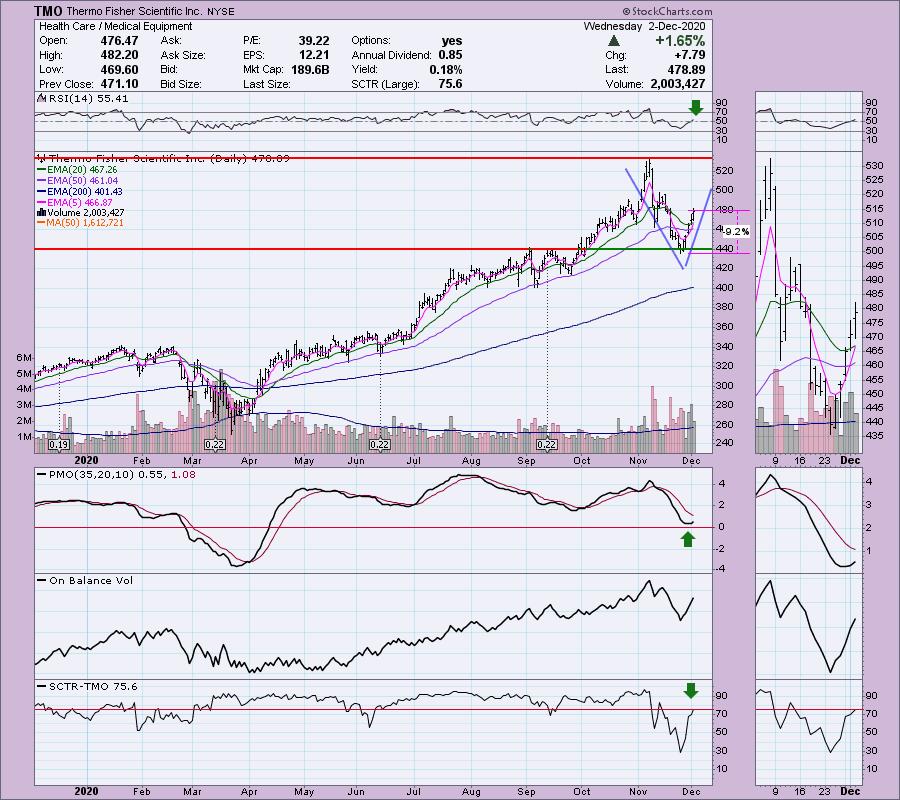
This one presented itself on my Diamond PMO Scan. I loved the chart immediately with its curling PMO, a newly positive RSI and a "V" bottom chart pattern. For those unfamiliar, a "V" bottom pattern is bullish and it executes when price has retraced 1/3 of the left side of the "V". When it does execute, the expectation is a strong rally past original overhead resistance at the top of the V. The stop is set at the bottom of the "V". Oh and I forgot to mention that the SCTR has just entered the "hot zone" above 75. (For new subscribers, I call it the "hot zone" because when it enters that area it is in the top quartile of its "universe", in this case, large-caps)
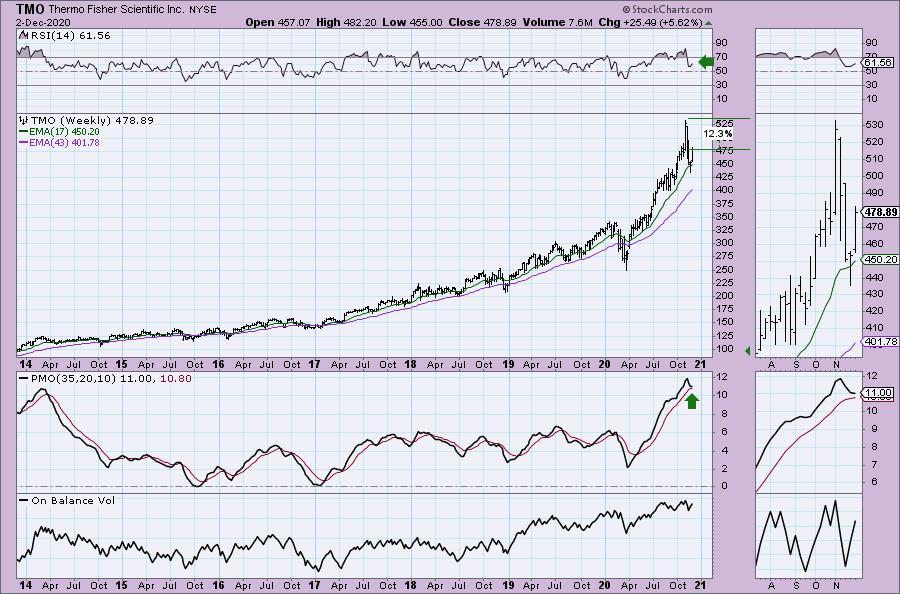
The weekly chart is pretty good. The RSI is positive and not overbought and although the PMO has topped, it is decelerating right now and could avoid a crossover SELL signal.
Full Disclosure: I'm about 70% invested and 30% is in 'cash', meaning in money markets and readily available to trade with.
Current Market Outlook:
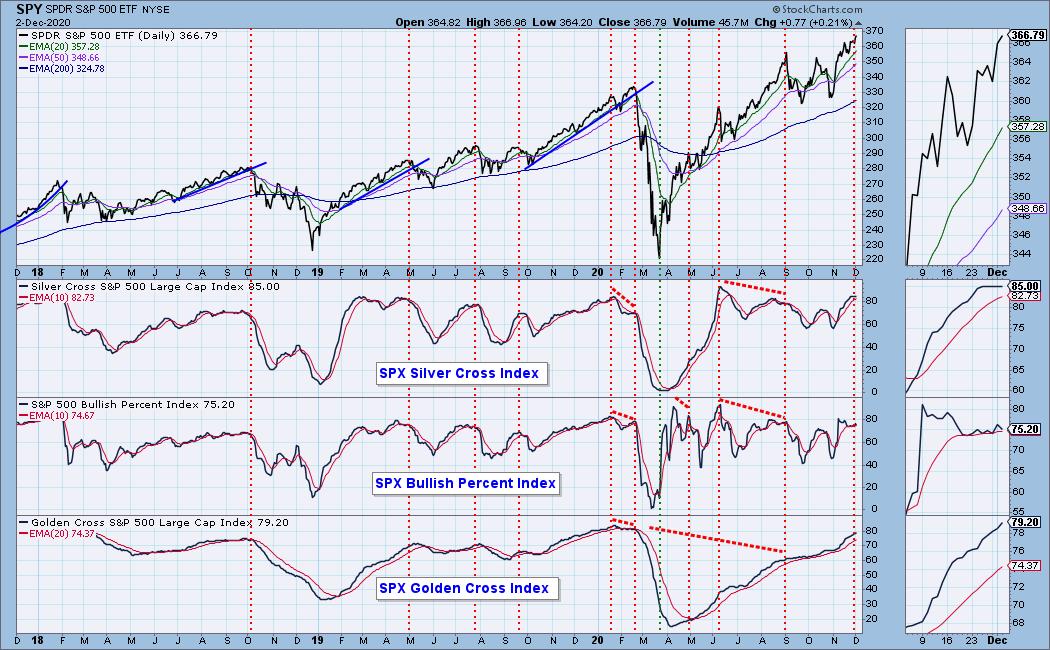
Market Environment: It is important to consider the odds for success by assessing the market tides. The following chart uses different methodologies for objectively showing the depth and trend of participation for intermediate- and long-term time frames.
- The Silver Cross Index (SCI) shows the percentage of SPX stocks on IT Trend Model BUY signals (20-EMA > 50-EMA)
- The Golden Cross Index (GCI) shows the percentage of SPX stocks on LT Trend Model BUY signals (50-EMA > 200-EMA)
- The Bullish Percent Index (BPI) shows the percentage of SPX stocks on Point & Figure BUY signals.
Don't forget that as a "Diamonds" member, you have access to our GCI/SCI curated ChartList on DecisionPoint.com. You'll find it under "Members Only" links on the left side on the Blogs and Links Page.
Here is the current chart:
Diamond Index:
- Diamond Scan Results: 3
- Diamond Dog Scan Results: 9
- Diamond Bull/Bear Ratio: 0.33
I'm in the process of trying to plot the Diamond Index, but with time at a premium, it is on the back burner.
Technical Analysis is a windsock, not a crystal ball.
Happy Charting!
- Erin
erin@decisionpoint.com
Watch the latest episode of DecisionPoint with Carl & Erin Swenlin on Mondays 7:00p EST or on the DecisionPoint playlist on the StockCharts TV YouTube channel here!
NOTE: The stocks reported herein are from mechanical trading model scans that are based upon moving average relationships, momentum and volume. DecisionPoint analysis is then applied to get five selections from the scans. The selections given should prompt readers to do a chart review using their own analysis process. This letter is not a call for a specific action to buy, sell or short any of the stocks provided. There are NO sure things or guaranteed returns on the daily selection of "diamonds in the rough."
Helpful DecisionPoint Links:
DecisionPoint Shared ChartList and DecisionPoint Chart Gallery
Price Momentum Oscillator (PMO)
Swenlin Trading Oscillators (STO-B and STO-V)
For more links, go to DecisionPoint.com!