
Today is Reader Request Day! Given the shortened week, there will be no Diamonds Recap this week. Instead we have five more picks for you to look at. I had some interesting requests. I decided to cover Raytheon (RTX) as it was requested in today's Diamond Mine trading room and it was on my "Stocks to Review" list yesterday.
In the trading room this morning, we talked about Coal. One of today's "Stocks to Review" is METC. The chart looks favorable, but I had so many other requests and I have covered it twice before on September 23rd 2021 (position still open and up 65%) and December 2nd 2021 (position is open and up 57%).
I have an amazing opportunity to present at the "Tech Wizards" event sponsored by TradeOutLoud and TimingResearch. I'll be sending out an email later tonight with the details, but you can register early right HERE. I was asked by a subscriber if I have my trading rules published anywhere. I don't! This event will lay them out and I will transfer the slides into an article.
Have a wonderful Easter weekend!
Today's "Diamonds in the Rough": LW, MRO, PTEN, RES and RTX.
Stocks to Review: AAL, HON, METC, SMPL and SILJ.

TODAY's RECORDING LINK (4/14/2022):
Topic: DecisionPoint Diamond Mine (4/14/2022) LIVE Trading Room
Start Time: Apr 14, 2022 09:00 AM
Meeting Recording Link.
Access Passcode: April@14
REGISTRATION FOR 4/22 Diamond Mine:
When: Apr 22, 2022 09:00 AM Pacific Time (US and Canada)
Topic: DecisionPoint Diamond Mine (4/22/2022) LIVE Trading Room
Register in advance for this webinar HERE.
** Save the registration confirmation email with login instructions in case Zoom doesn't notify you in time.**

Free DP Trading Room (4/11) RECORDING LINK:
Topic: DecisionPoint Trading Room
Start Time: Apr 11, 2022 09:00 AM
Meeting Recording Link.
Access Passcode: April@11
For best results, copy and paste the access code to avoid typos.
Welcome to DecisionPoint Daily Diamonds, wherein I highlight ten "Diamonds in the Rough" per week. These are selected from the results of my DecisionPoint Scans, which search for stocks that could benefit from the trend and condition of the market. Remember, these are not recommendations to buy or sell, but are the most interesting of the stocks that surfaced in my scans. My objective is to save you the work of the initial, tedious culling process, but you need to apply your own analysis to see if these stocks pique your interest as well. There are no guaranteed winners here!
"Predefined Scans Triggered" are taken from StockCharts.com using the "Symbol Summary" option instead of a "SharpChart" on the workbench.
Lamb Weston Holdings, Inc. (LW)
EARNINGS: 7/27/2022 (BMO)
Lamb Weston Holdings, Inc. engages in the production, distribution, and marketing of value-added frozen potato products. It operates through the following business segments: Global, Foodservice, Retail, and Other. The Global segment includes branded and private label frozen potato products sold in North America and international markets. The Foodservice segment comprises branded and private label frozen potato products sold throughout the United States and Canada. The Retail segment consists of consumer facing retail branded and private label frozen potato products sold primarily to grocery, mass merchants, club, and specialty retailers. The Other segment comprises vegetable and dairy businesses. The company was founded on July 5, 2016, and is headquartered in Eagle, ID.
Predefined Scans Triggered: P&F Spread Triple Top Breakout, Moved Above Upper Price Channel and P&F Double Top Breakout.
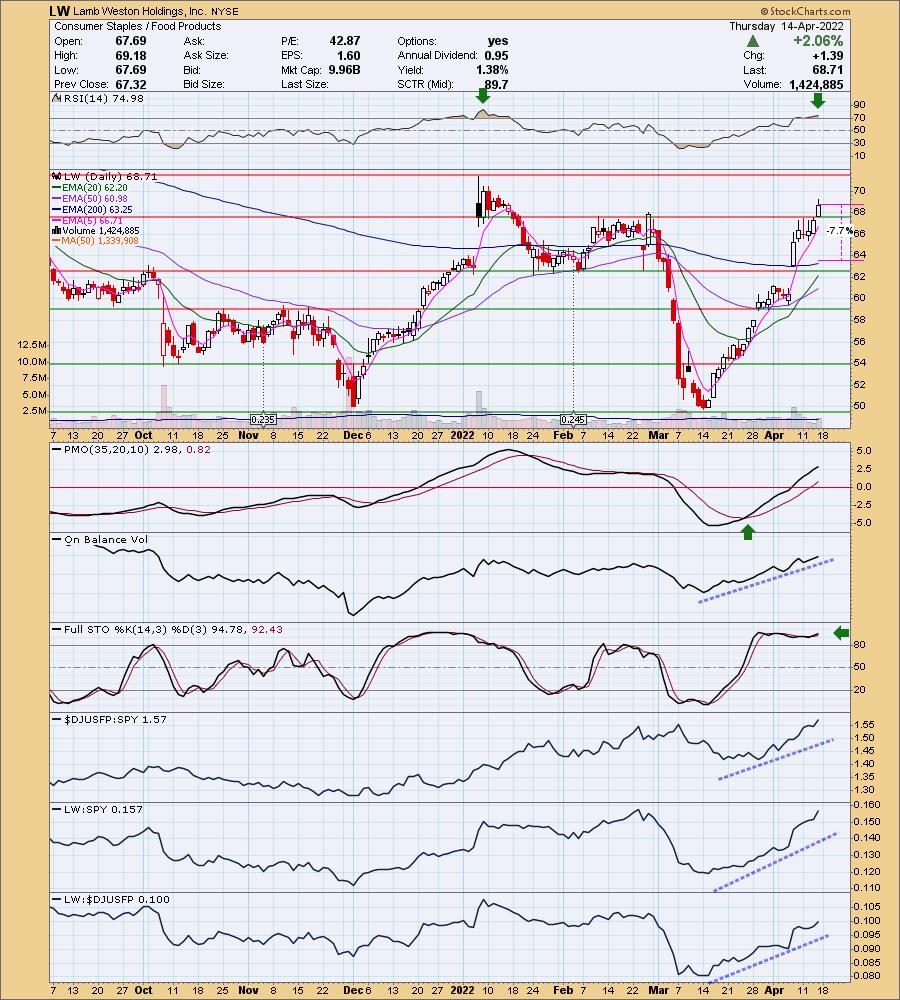
LW is down -0.36% in after hours trading. For those in the Diamond Mine this morning, you know that I like Consumer Staples (XLP) as a sector to watch next week. One of the strong groups within the sector is Food Products. I don't know that rally is over as the sector is showing incredible participation. The RSI is overbought, but you can see that it has been even more overbought this year. Of course, that did mark the end of its strong rally, so keep that in mind. Price has broken out above February resistance, but January resistance is right around the corner. The PMO is rising strongly and isn't quite overbought yet. The stop is set at the 200-day EMA.
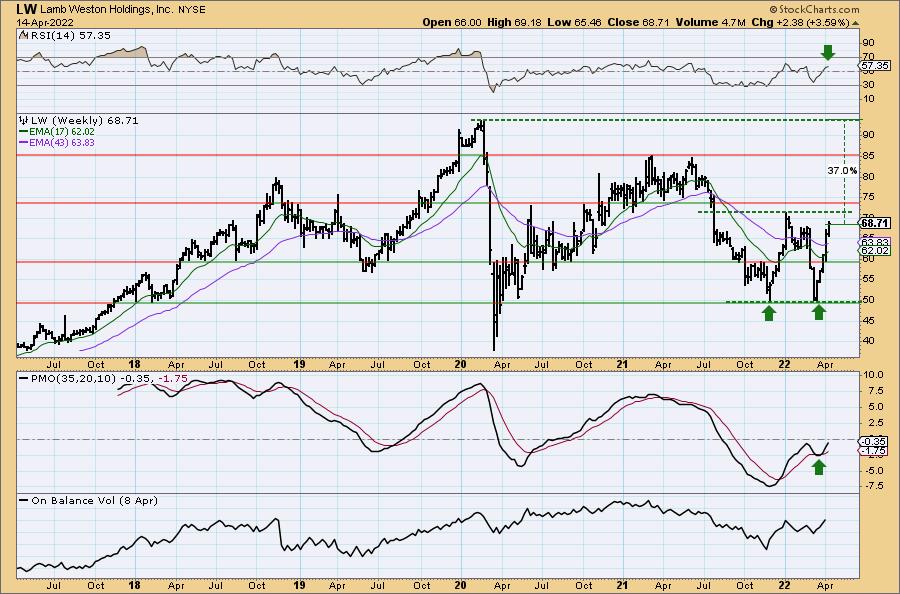
There is a very large bullish double-bottom pattern on the weekly chart. The minimum upside target of that pattern would take price back to all-time highs. The weekly RSI is positive and the weekly PMO reversed back into a crossover BUY signal and is still rising. It should reach positive territory soon. If it gets to all-time highs, that would be a 37% gain.
Marathon Oil (MRO)
EARNINGS: 5/4/2022 (AMC)
Marathon Oil Corp. engages in the exploration, production, and marketing of liquid hydrocarbons and natural gas. It operates through the following two segments: United States (U. S.) and International. The U. S. segment engages in oil and gas exploration, development and production activities in the U.S. The International segment engages in oil and gas development and production across international locations primarily in Equatorial Guinea and the United Kingdom. The company was founded in 1887 and is headquartered in Houston, TX.
Predefined Scans Triggered: P&F Ascending Triple Top Breakout and P&F Double Top Breakout.
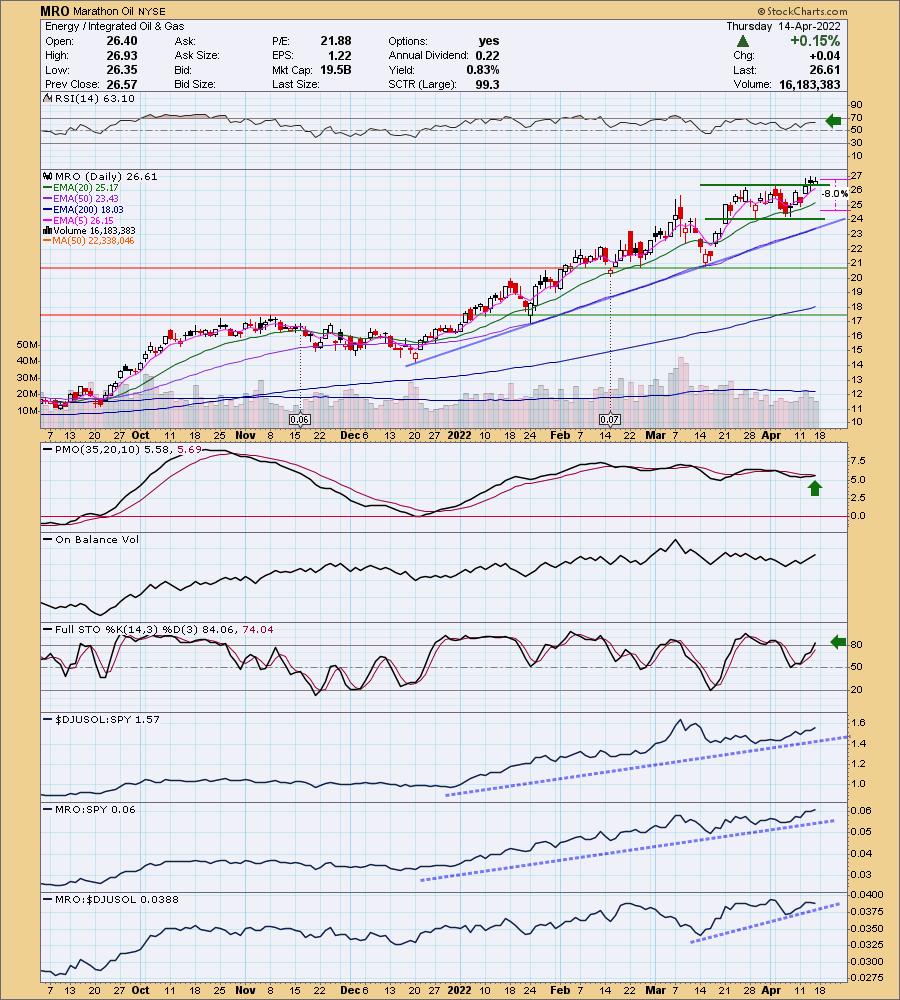
MRO is unchanged in after hours trading. Price is breaking out of a consolidation zone and still is holding above it. The RSI is positive and not overbought. The PMO is nearing a crossover BUY signal. Stochastics have just moved above 80 which suggests internal strength. The stop is set below the 20-day EMA about three quarters down the prior trading channel.
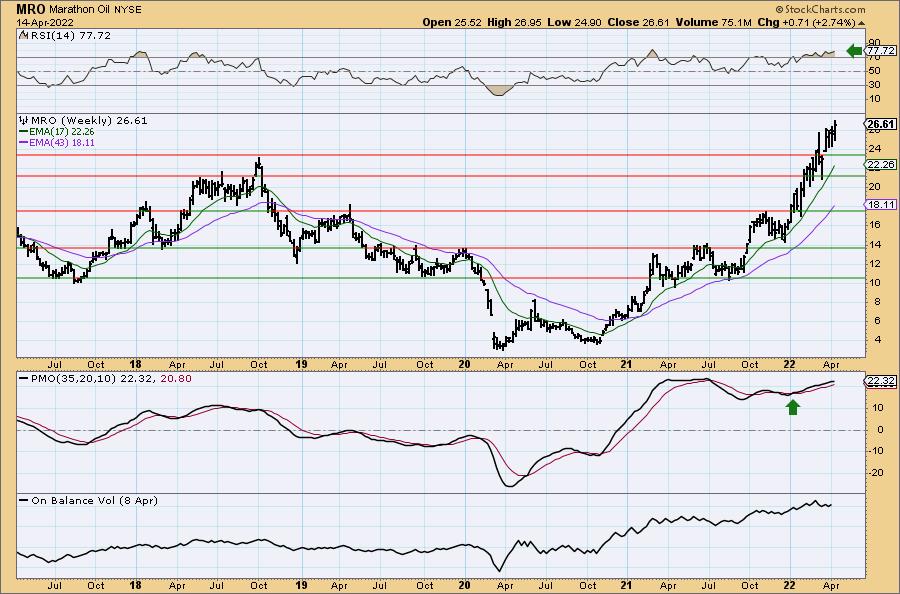
The weekly RSI is overbought, but what's new? The multi-year breakout is promising and the weekly PMO is rising on a BUY signal. It is unfortunately overbought, but given what we know about Oil prices, it will likely continue even higher.
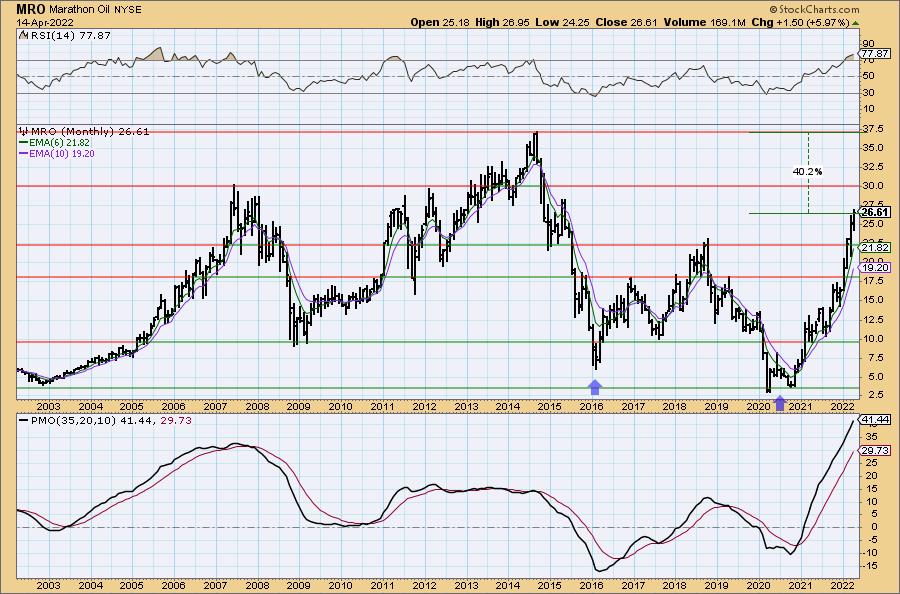
I put the monthly chart in so you could see the very large bullish double-bottom pattern on the chart. That pattern was confirmed in February on the breakout. Both the monthly RSI and PMO are extremely overbought, but look at 2005, 2006 through end of 2007. The RSI was overbought for literally years. Upside potential is over 40%.
Patterson-UTI Energy, Inc. (PTEN)
EARNINGS: 4/28/2022 (BMO)
Patterson-UTI Energy, Inc. engages in the provision of drilling and pressure pumping services, directional drilling, rental equipment and technology. It operates through the following segments: Contract Drilling Services, Pressure Pumping Services, and Directional Drilling Services. The Contract Drilling Services segment markets its services to major and independent oil and natural gas operators. The Pressure Pumping Services segment offers pressure pumping services to oil and natural gas operators primarily in Texas and the Appalachian Basin. The Directional Drilling Services segment consists of downhole performance motors and equipment to provide services including directional drilling, downhole performance motors, motor rentals, directional surveying, measurement-while-drilling, and wireline steering tools, in most major onshore oil and natural gas basins. The company was founded by Cloyce A. Talbott and A. Glenn Patterson in 1978 and is headquartered in Houston, TX.
Predefined Scans Triggered: New 52-week Highs and P&F Double Top Breakout.
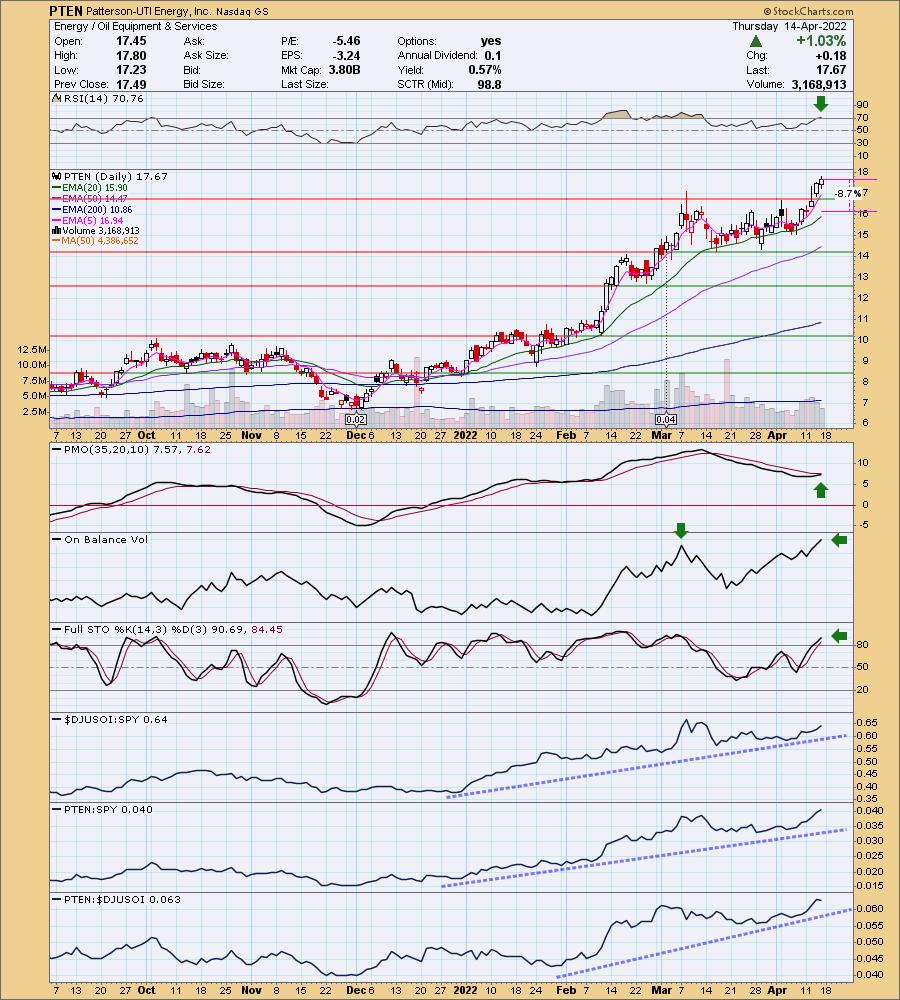
PTEN is unchanged in after hours trading. I see a trading zone that price has broken above. I don't like that the RSI is overbought, but we saw it stay overbought through mid-February to mid-March. The PMO is nearing a crossover BUY signal. The OBV broke above its previous high which confirms the breakout. Stochastics are rising above 80 and relative strength is strong across the board. The stop is rather deep. It lines up around the 20-day EMA.
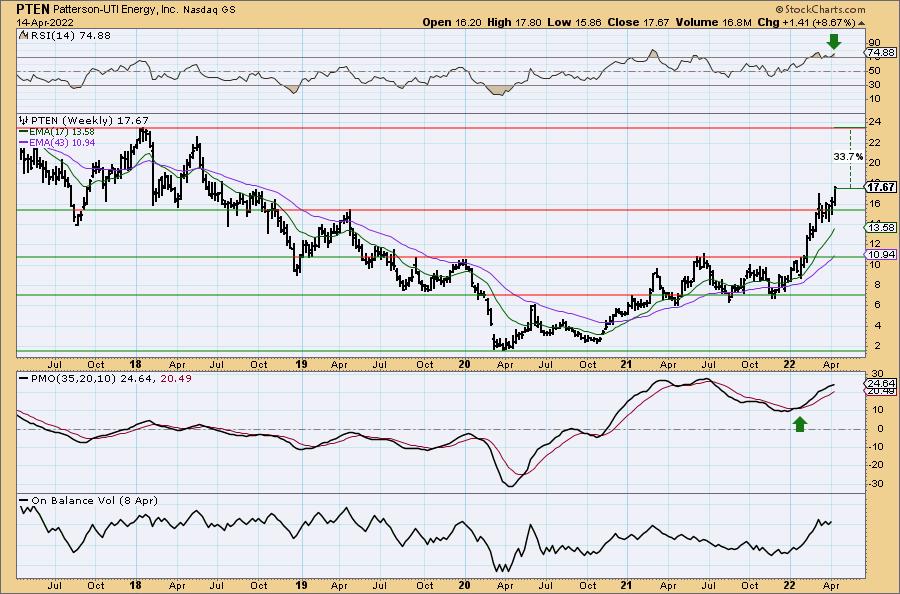
The weekly RSI is overbought and typically PTEN doesn't like that. However, it has broken above resistance and the weekly PMO is on BUY signal and rising. It's a bit overbought. Upside potential is over 33%.
RPC, Inc. (RES)
EARNINGS: 4/27/2022 (BMO)
RPC, Inc. engages in the exploration, production and development of oil and gas properties. It operates through the following segments: Technical Services and Support Services. The Technical Services segment provides oil and gas, fracturing, acidizing, coiled tubing, snubbing, nitrogen, well control, wireline and fishing services. The Support Services segment offers oilfield pipe inspection services and rental tools for use with onshore and offshore oil and gas well drilling. The company was founded in 1984 and is headquartered in Atlanta, GA.
Predefined Scans Triggered: New 52-week Highs, Moved Above Upper Price Channel, P&F Double Top Breakout, P&F Triple Top Breakout and P&F Quadruple Top Breakout.
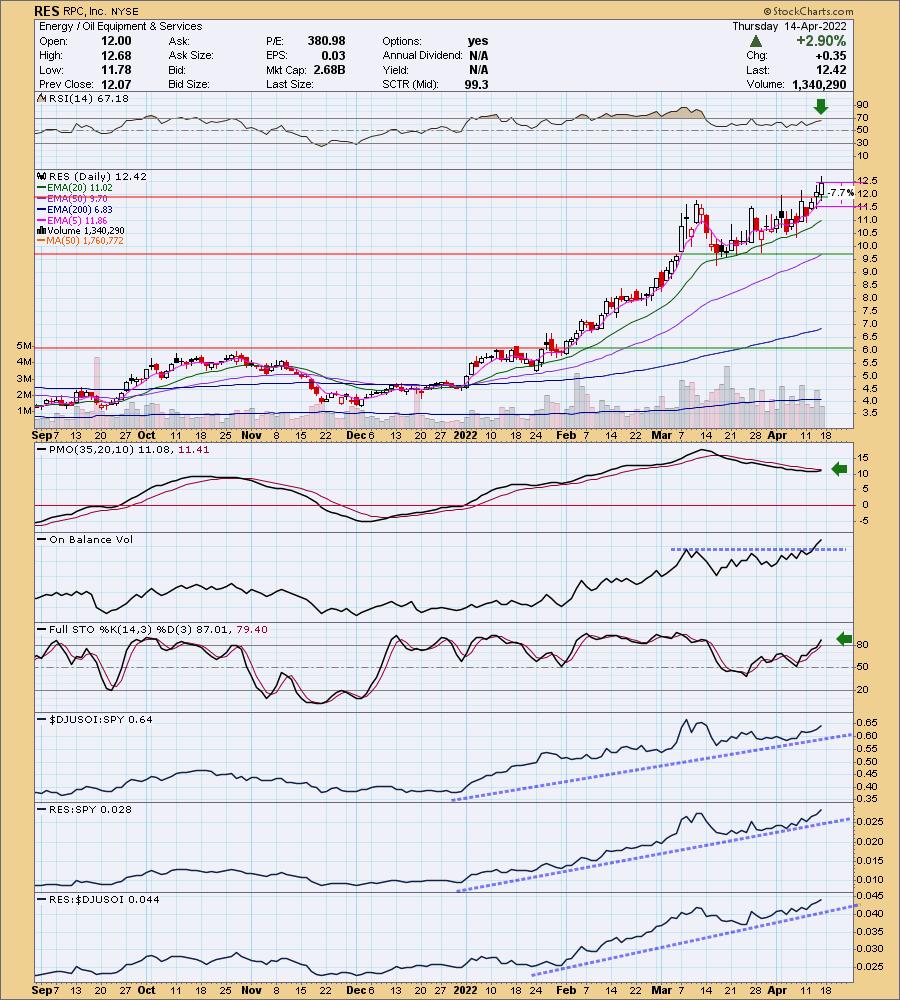
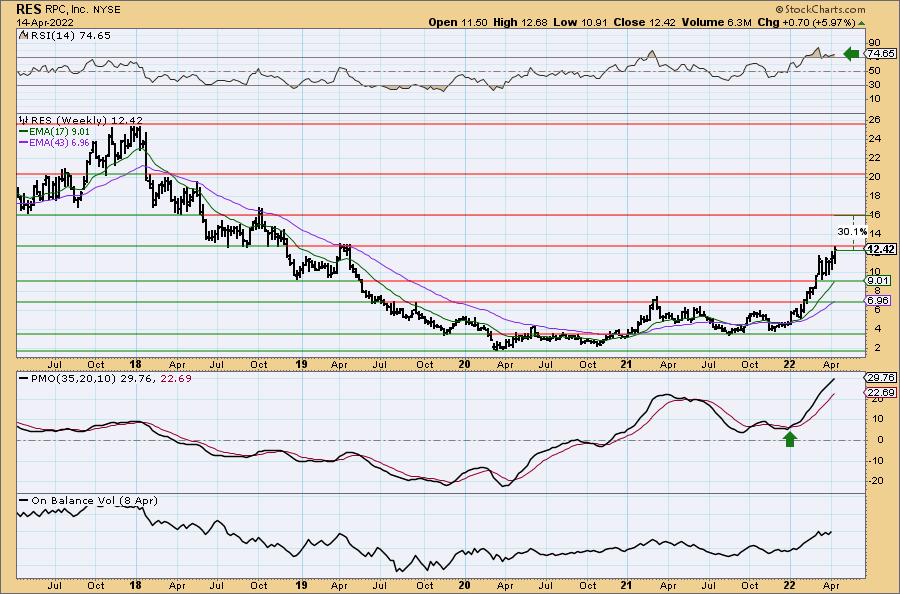
RES is up +0.64% in after hours trading. I still like Energy and I really like this breakout on RES. The RSI is positive and not overbought, the PMO is nearing a crossover BUY signal and Stochastics are now above 80. The OBV hit a new high on this breakout for confirmation. Relative strength is stellar. I've set the stop below support around $11.50.
The weekly chart show an overbought RSI and weekly PMO, but both are rising strongly. This is a nice bottoming formation. It is up against resistance at the late 2017 low and early 2018 lows, but with this sector and industry group booming, I would look for it to move beyond the 30% upside target.
Raytheon Technologies Corp. (RTX)
EARNINGS: 4/26/2022 (BMO)
Raytheon Technologies Corp. is an aerospace and defense company, which engages in the provision of aerospace and defense systems and services for commercial, military, and government customers. It operates through the following segments: Collins Aerospace Systems, Pratt and Whitney, Raytheon Intelligence and Space, and Raytheon Missiles and Defense. The Collins Aerospace Systems segment manufactures and sells aero structures, avionics, interiors, mechanical systems, mission systems, and power controls. The Pratt and Whitney segment includes the design and manufacture of aircraft engines and auxiliary power systems for commercial, military, and business aircraft. The Raytheon Intelligence and Space segment is involved in the development of sensors, training, and cyber and software solutions. The Raytheon Missiles and Defense segment offers end-to-end solutions to detect, track, and engage threats. The company was founded in 1922 and is headquartered in Waltham, MA.
Predefined Scans Triggered: New 52-week Highs, Moved Above Upper Bollinger Band, P&F Ascending Triple Top Breakout and P&F Double Top Breakout.
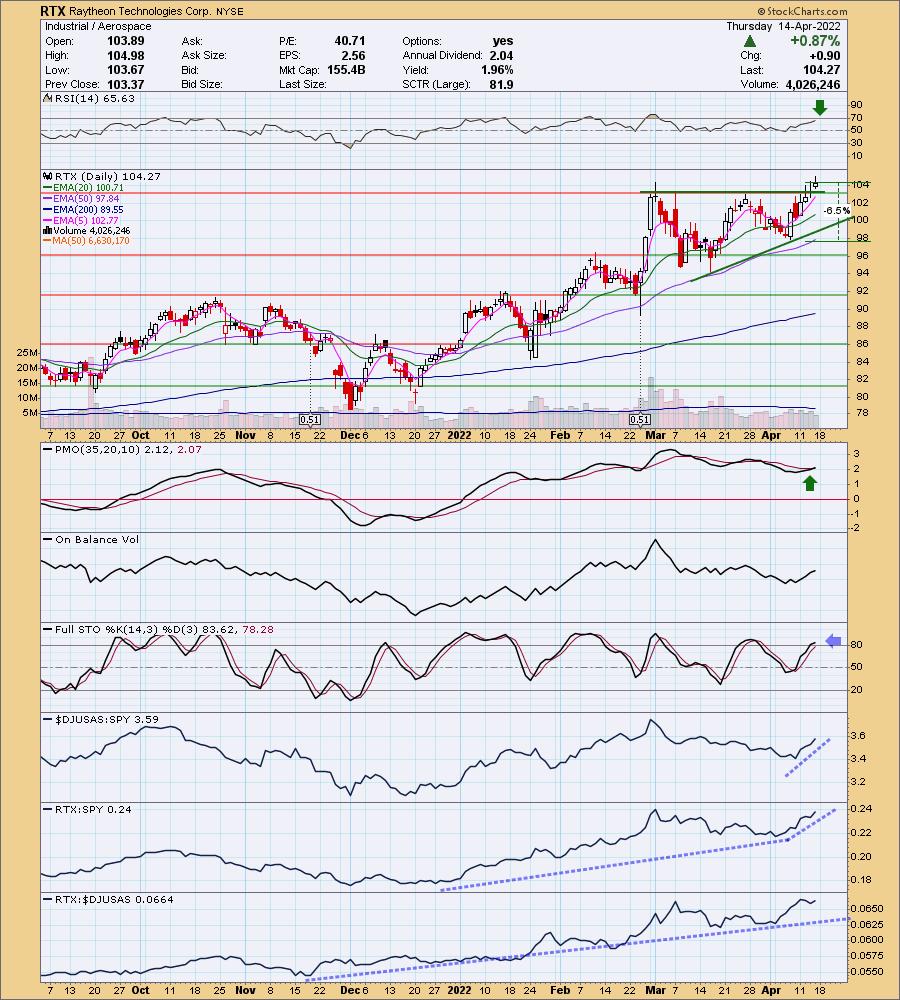
RTX is up +0.17% in after hours trading. I am surprised that I've never covered this stock! Right now price is breaking out as expected from a bullish ascending triangle. The RSI is positive and the PMO just gave us a crossover. Stochastic just moved above 80 suggesting internal strength. I'm not thrilled with the negative divergence on the OBV (declining OBV tops with rising price tops), but the rest of the chart is near perfection. Relative strength is proof of that. The stop can even be set somewhat thinly on a breakdown of the rising trend or at the 50-day EMA.
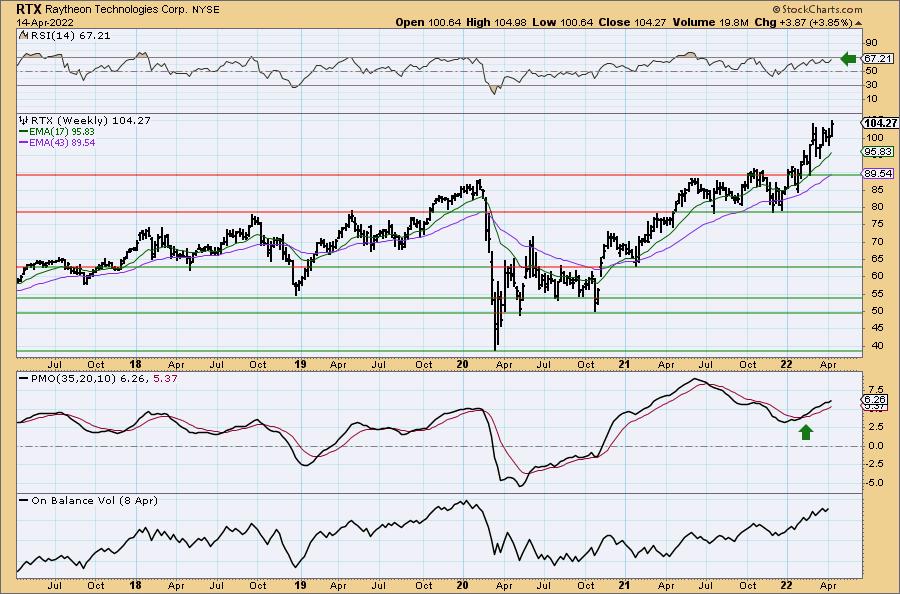
RTX is making new all-time highs as it rallies. The weekly RSI is positive and not overbought and the weekly PMO is rising and not overbought on a crossover BUY signal. I definitely like this one. It will be on my radar on Monday. Upside target can be set at 14% around $118.87.
Don't forget, on Thursdays I look at reader-requested symbols, click HERE to shoot me an email. I read every email I receive and try to answer them all!
Current Market Outlook:
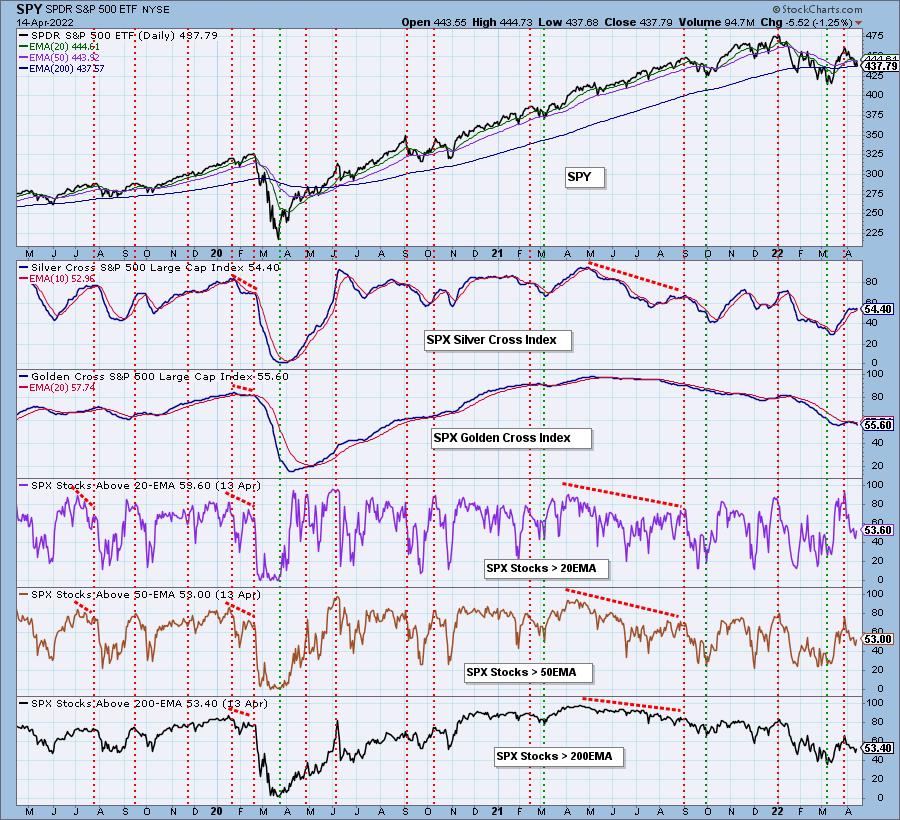
Market Environment: It is important to consider the odds for success by assessing the market tides. The following chart uses different methodologies for objectively showing the depth and trend of participation for intermediate- and long-term time frames.
- The Silver Cross Index (SCI) shows the percentage of SPX stocks on IT Trend Model BUY signals (20-EMA > 50-EMA)
- The Golden Cross Index (GCI) shows the percentage of SPX stocks on LT Trend Model BUY signals (50-EMA > 200-EMA)
Don't forget that as a "Diamonds" member, you have access to our GCI/SCI curated ChartList on DecisionPoint.com. You'll find it under "Members Only" links on the left side on the Blogs and Links Page.
Here is the current chart:
Full Disclosure: I'm 15% invested and 85% is in 'cash', meaning in money markets and readily available to trade with. Contemplating RTX.
I'm required to disclose if I currently own a stock and/or may buy it within the next 72 hours.
Good Luck and Good Trading!
- Erin
"Technical Analysis is a windsock, not a crystal ball." - Carl Swenlin
(c) Copyright 2022 DecisionPoint.com
Watch the latest episode of DecisionPoint with Carl & Erin Swenlin on Mondays 7:00p EST or on the DecisionPoint playlist on the StockCharts TV YouTube channel here!
NOTE: The stocks reported herein are from mechanical trading model scans that are based upon moving average relationships, momentum and volume. DecisionPoint analysis is then applied to get five selections from the scans. The selections given should prompt readers to do a chart review using their own analysis process. This letter is not a call for a specific action to buy, sell or short any of the stocks provided. There are NO sure things or guaranteed returns on the daily selection of "Diamonds in the Rough."
Helpful DecisionPoint Links:
DecisionPoint Shared ChartList and DecisionPoint Chart Gallery
Price Momentum Oscillator (PMO)
Swenlin Trading Oscillators (STO-B and STO-V)
For more links, go to DecisionPoint.com