
My scans did produce a few stocks of interest. In fact, one of the stocks that was requested was in the results of one of my DP scans so it was an easy add. I have a big mega-cap name for you that was brought to the table. I also have one of the stocks I already own. There's a Biotech and an Energy stock included.
I was at the dentist this morning, so I'm not feeling so great. Tomorrow is the Diamond Mine trading room! Sign up now at this link or the one below.
Today's Reader Requests: AAPL, DVN, FLOW, METC and SRPT.

RECORDING LINK Wednesday (11/24):
Topic: DP Diamond Mine (WEDNESDAY 11/24/2021) LIVE Trading Room
Start Time: Nov 24, 2021 08:59 AM
Meeting Recording Link.
Access Passcode: Turkey@24
REGISTRATION FOR Friday 12/3 Diamond Mine:
When: Dec 3, 2021 09:00 AM Pacific Time (US and Canada)
Topic: DecisionPoint Diamond Mine (12/3/2021) LIVE Trading Room
Register in advance for this webinar HERE.
Save the registration confirmation email with login instructions in case Zoom doesn't notify you in time.

Free DP Trading Room (11/22) RECORDING LINK:
Topic: DecisionPoint Trading Room
Start Time: Nov 22, 2021 09:00 AM
Meeting Recording Link.
Access Passcode: November@22
For best results, copy and paste the access code to avoid typos.
Welcome to DecisionPoint Daily Diamonds, wherein I highlight ten "Diamonds in the Rough" per week. These are selected from the results of my DecisionPoint scans, which search for stocks that could benefit from the trend and condition of the market. Remember, these are not recommendations to buy or sell, but are the most interesting of the stocks that surfaced in my scans. My objective is to save you the work of the initial, tedious culling process, but you need to apply your own analysis to see if these stocks pique your interest as well. There are no guaranteed winners here!
Apple, Inc. (AAPL)
EARNINGS: 1/26/2022 (AMC)
Apple, Inc. engages in the design, manufacture, and sale of smartphones, personal computers, tablets, wearables and accessories, and other variety of related services. It operates through the following geographical segments: Americas, Europe, Greater China, Japan, and Rest of Asia Pacific. The Americas segment includes North and South America. The Europe segment consists of European countries, as well as India, the Middle East, and Africa. The Greater China segment comprises of China, Hong Kong, and Taiwan. The Rest of Asia Pacific segment includes Australia and Asian countries. Its products and services include iPhone, Mac, iPad, AirPods, Apple TV, Apple Watch, Beats products, Apple Care, iCloud, digital content stores, streaming, and licensing services. The company was founded by Steven Paul Jobs, Ronald Gerald Wayne, and Stephen G. Wozniak in April 1976 and is headquartered in Cupertino, CA.
Predefined Scans Triggered: Elder Bar Turned Blue, Parabolic SAR Sell Signals, Hollow Red Candles and P&F High Pole.
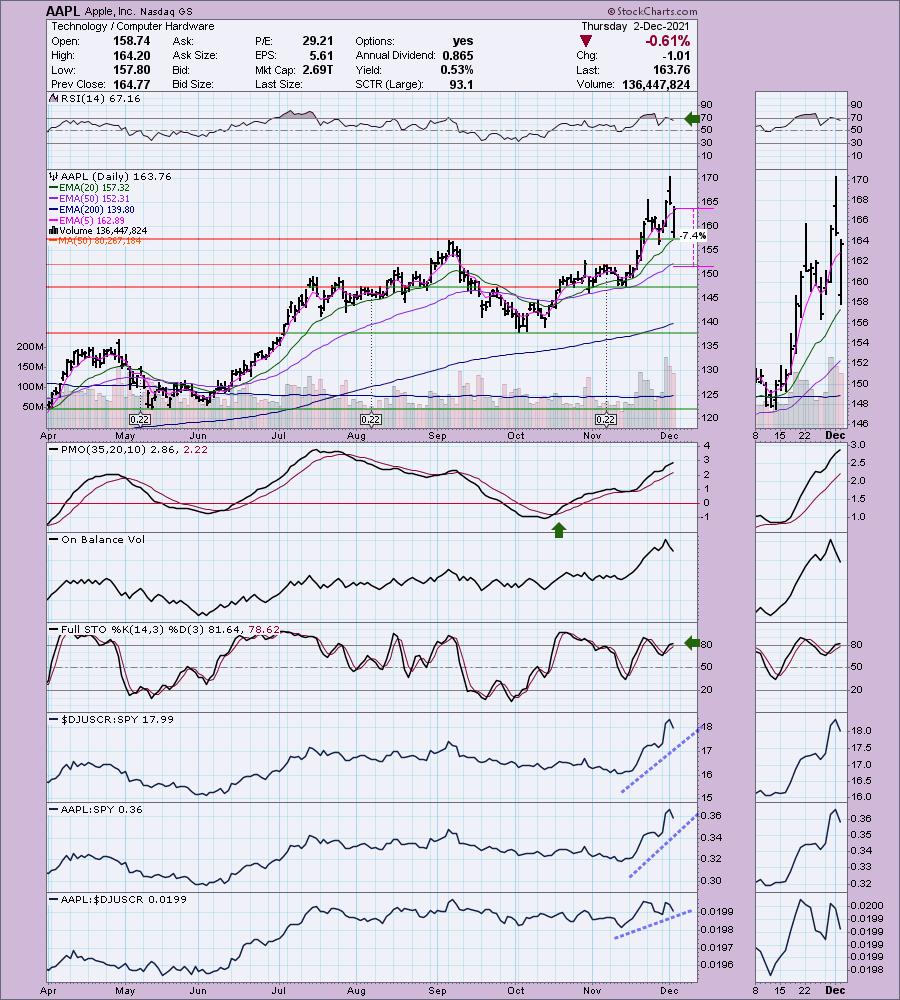
AAPL is up +0.05% in after hours trading. I've covered Apple three times before. The first time it was a watch list candidate on March 3rd 2020. Here is a link to the last two times on December 12th 2020 and May 4th 2020. The stops on the last two did not hit. The December position is up +32.9%. The May position is up +123.4% (I calculated it based on the split).
Apple is a leader of the market and that is one of the main reasons I would hesitate here as the market is very weak. However, that aside, the chart is bullish. Price has just landed on the 20-EMA and rebounded today. The RSI is positive, the PMO is rising and not quite overbought. Volume has been coming in strong since mid-November. Stochastics are positive and relative strength studies are strong. The stop is set below the October top and below the 50-EMA.
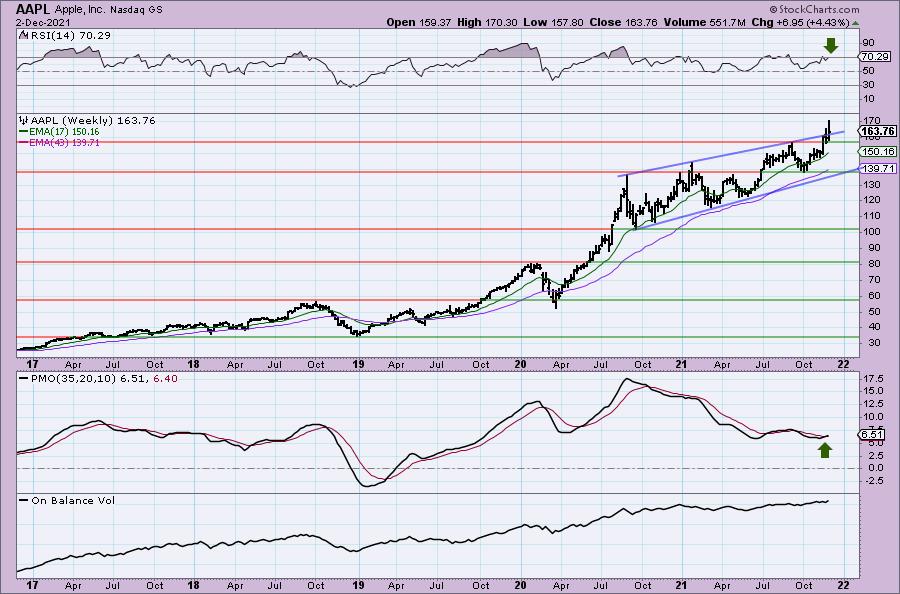
The weekly chart is bullish with a positive (albeit overbought) RSI and a new weekly PMO BUY signal. Price is breaking out of the top of a bearish rising wedge. Bullish conclusions to bearish patterns is especially bullish.
Devon Energy Corp. (DVN)
EARNINGS: 2/15/2022 (AMC)
Devon Energy Corp. engages in the exploration, development, and production of oil and natural gas properties. It develops and operates Delaware Basin, Eagle Ford, Heavy Oil, Baarnett Shale, STACK, and Rockies Oil. The company was founded by J. Larry Nichols and John W. Nichols in 1971 and is headquartered in Oklahoma City, OK.
Predefined Scans Triggered: New CCI Sell Signals.
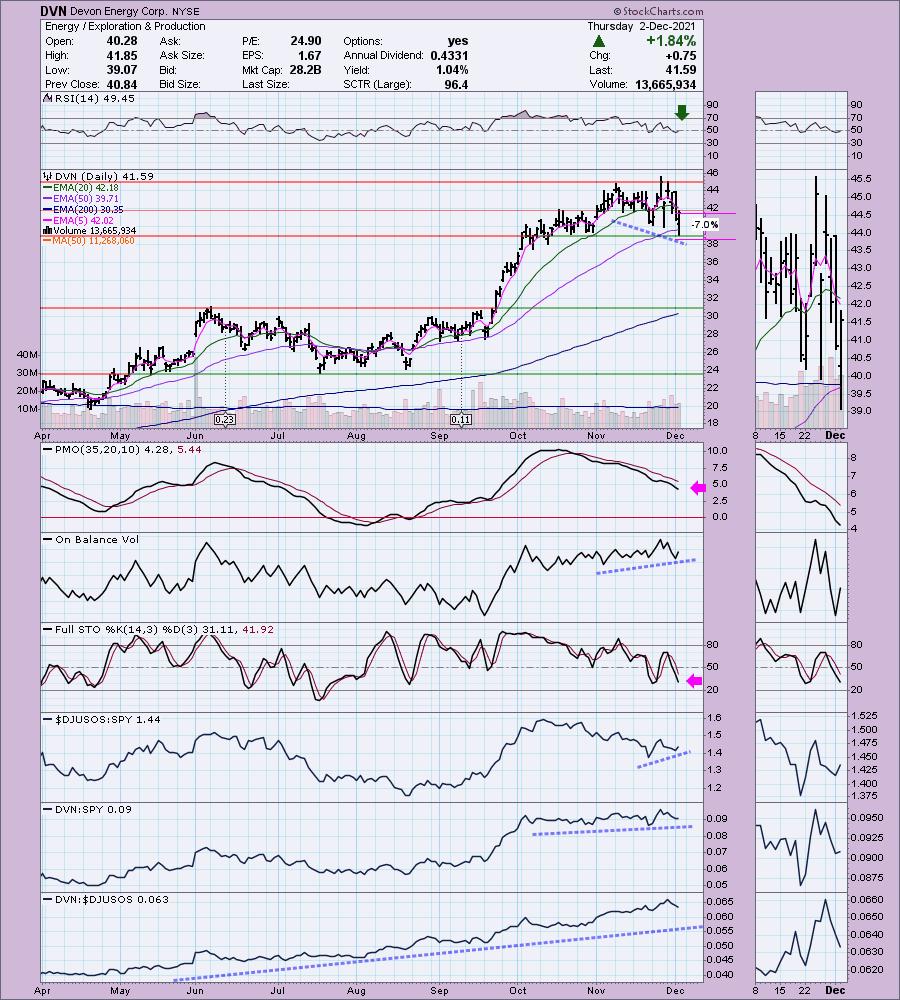
DVN is up +0.50% in after hours trading. This isn't the best chart, but I know this reader has been mentioning it to me a few times. The best thing it has going for it is a possible rebound off the 50-EMA. Since being on a "Silver Cross" BUY signal (20-EMA crossed above the 50-EMA) the 50-EMA has held as support. The RSI is rising, but is neutral right now. The PMO is a big problem for me. It is not showing signs of deceleration yet. It does have a nice OBV positive divergence. Stochastics are negative and still falling. In the longer-term DVN and even the group have been outperforming the SPY. It's not my style of investment, but as I mentioned, it does have some bullish features. The stop is set below support and the 50-EMA.
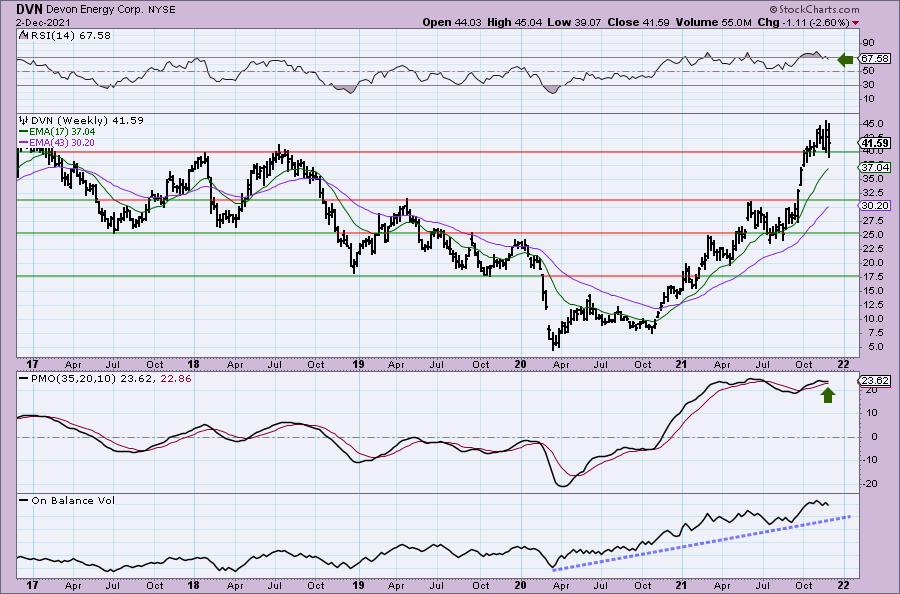
The weekly chart is positive given the weekly PMO is trying to turn back up above its signal line and the RSI is positive and no longer overbought. I'd consider an upside target of 15% at $47.83.
SPX FLOW Inc. (FLOW)
EARNINGS: 2/9/2022 (BMO)
SPX Flow, Inc. engages in manufacturing and distributing industrial components. It operates through the following segments: Food & Beverage and Industrial. The Food and Beverage segment includes mixing, drying, evaporation, and separation systems and components, heat exchangers, and reciprocating and centrifugal pump technologies. The Industrial segment serves customers in the chemical, air treatment, mining, pharmaceutical, marine, shipbuilding, infrastructure construction, general industrial and water treatment industries. The company was founded in 1912 and is headquartered in Charlotte, NC.
Predefined Scans Triggered: None.
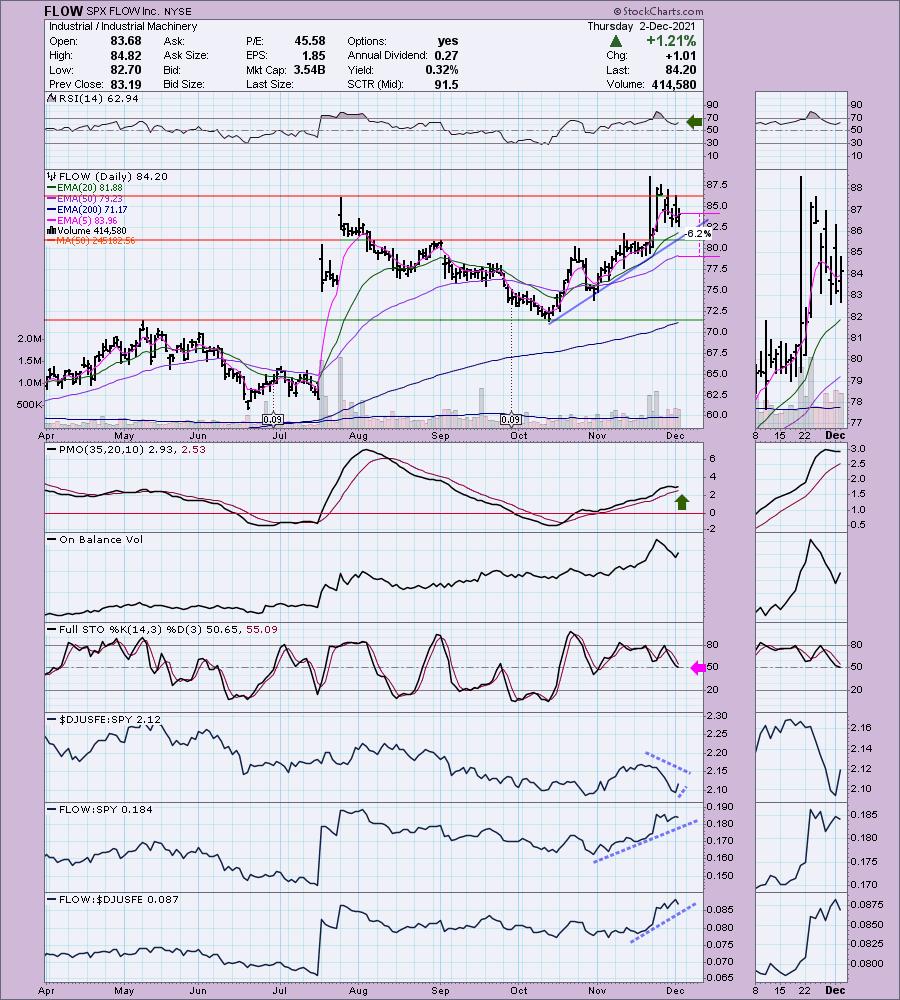
FLOW is unchanged in after hours trading. I covered it back on October 20th 2021. The position is still open and is up +8.66%. Full disclosure, I do own this one. This is a nice chart with a positive RSI and PMO beginning to turn up above the signal line. I don't like the heavy selling over the past week, but it is holding its rising trend and above the 20-EMA. Stochastics are starting to turn back up in positive territory. The group is underperforming, but FLOW is outperforming both the group and the SPY. You can set a stop at the 50-EMA or tighten it to below the September top.
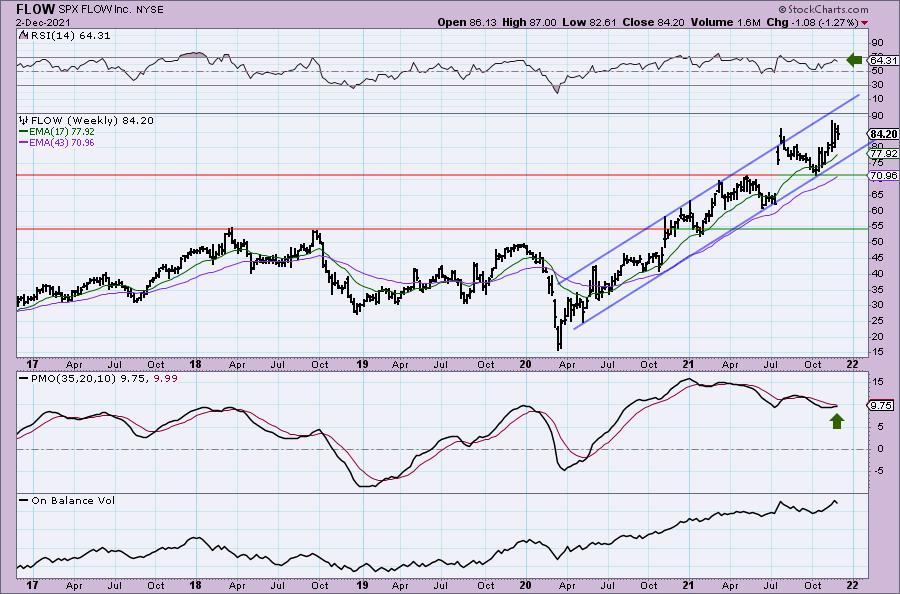
Currently flow is traveling in a healthy rising trend channel. The weekly RSI is positive and the weekly PMO is going in for a crossover BUY signal.
Ramaco Resources, Inc. (METC)
EARNINGS: 2/17/2022 (AMC)
Ramaco Resources, Inc. engages in the operation and development of coal mining properties. The firm deals with metallurgical coal in central and southern West Virginia, southwestern Virginia and southwestern Pennsylvania. Its portfolio consists of Elk Creek, Berwind, RAM Mine, and Knox Creek. The company was founded by Randall W. Atkins in August 2015 and is headquartered in Lexington, KY.
Predefined Scans Triggered: Elder Bar Turned Green and Bullish MACD Crossovers.
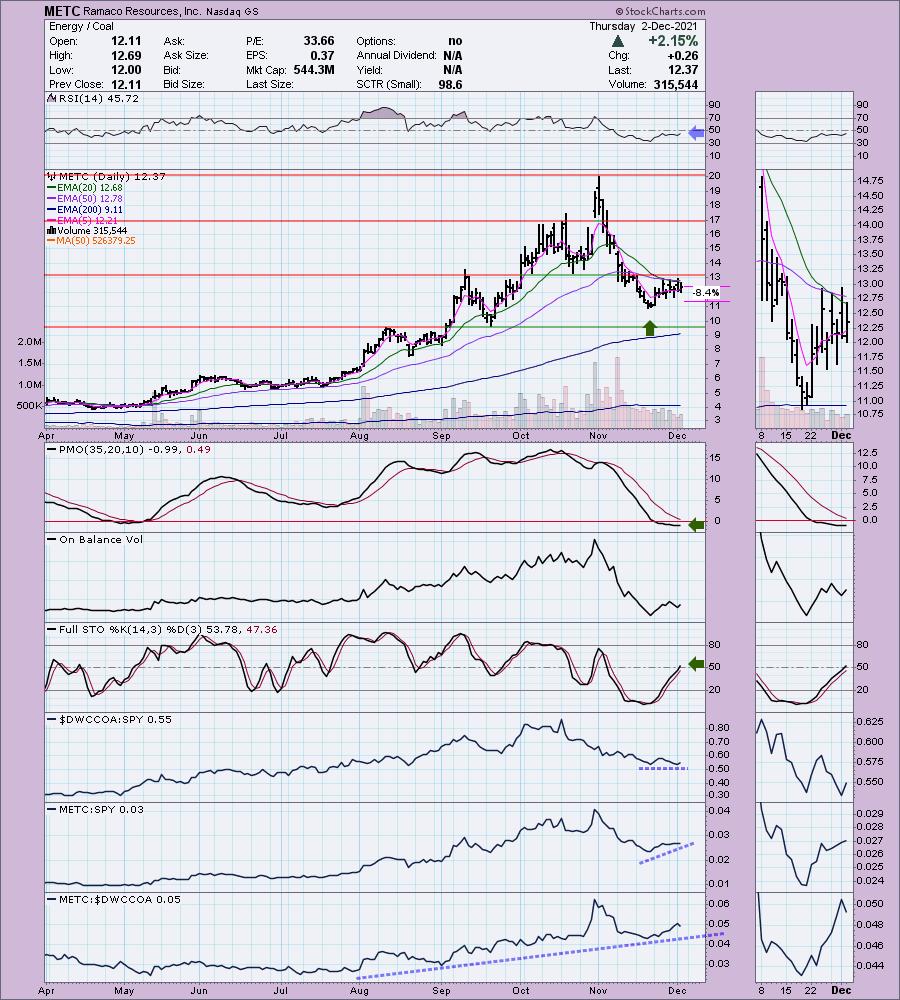
METC is unchanged in after hours trading. I covered METC on September 23rd 2021. The position did not hit its stop, but came close on that early November waterfall decline. This request actually came in on November 19th which was a perfect call at the bottom. I like Coal right now even though it isn't really outperforming the market right now. This stock came up in today's scans. The RSI is still negative but is rising now. The PMO is still technically in decline but it looks like it will turn up for a crossover BUY signal. Stochastics are rising and just hit positive territory. Relative strength looks good for the stock. The stop is set near the late November lows at 8.4%.
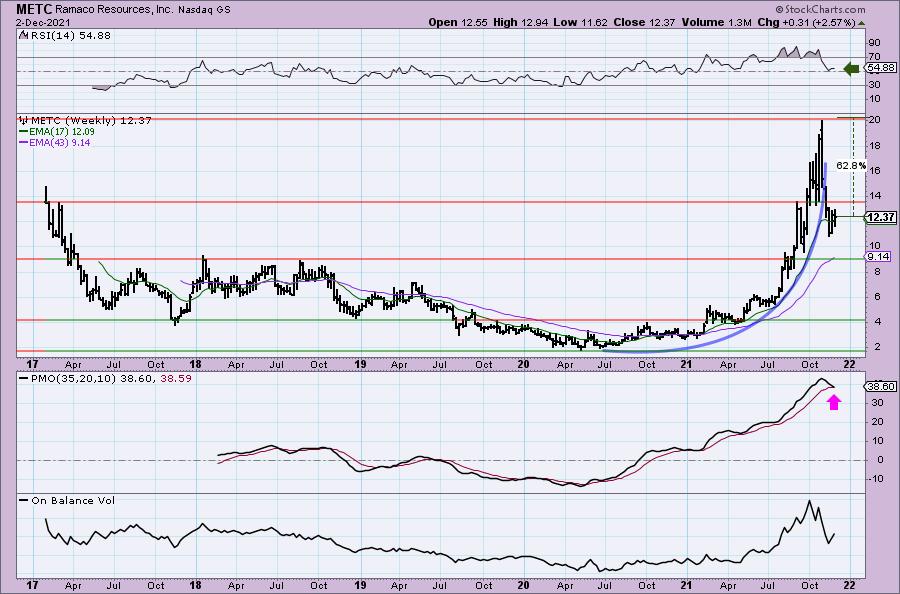
The weekly chart shows a textbook parabolic breakdown. Usually they will find there way down to the last basing pattern and METC isn't actually there yet. The weekly PMO is about to trigger a crossover SELL signal so it's still a bit iffy right now. The weekly RSI is positive and upside potential if it can reach prior highs is over 62%.
Sarepta Therapeutics, Inc. (SRPT)
EARNINGS: 2/28/2022 (AMC)
Sarepta Therapeutics, Inc. is a commercial-stage biopharmaceutical company, which is engaged in the discovery and development of therapeutics for the treatment of rare diseases. The company was founded on July 22, 1980 and is headquartered in Cambridge, MA.
Predefined Scans Triggered: Bullish MACD crossovers.
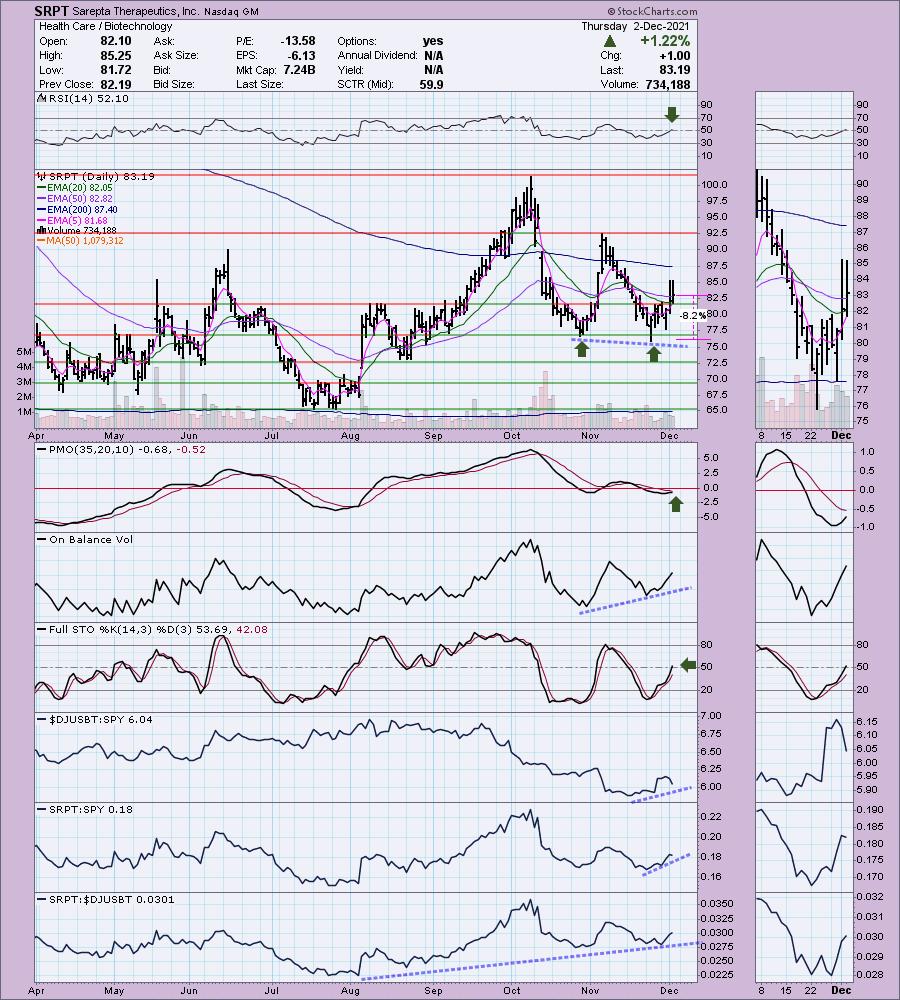
SRPT is up +0.91% in after hours trading. This is my pick for the day. I really like this chart. It's very tempting, but I'm sticking with not expanding my exposure just yet. Every element I look for on a chart is here. We have a beautiful double-bottom pattern developing. The RSI and Stochastics just entered positive territory. There is a positive OBV divergence. Relative strength studies look pretty good, although the group itself is beginning to deteriorate. Biotechs are volatile and sometimes risky so when the market is weak, investors usually leave. The stop is set below the October low.
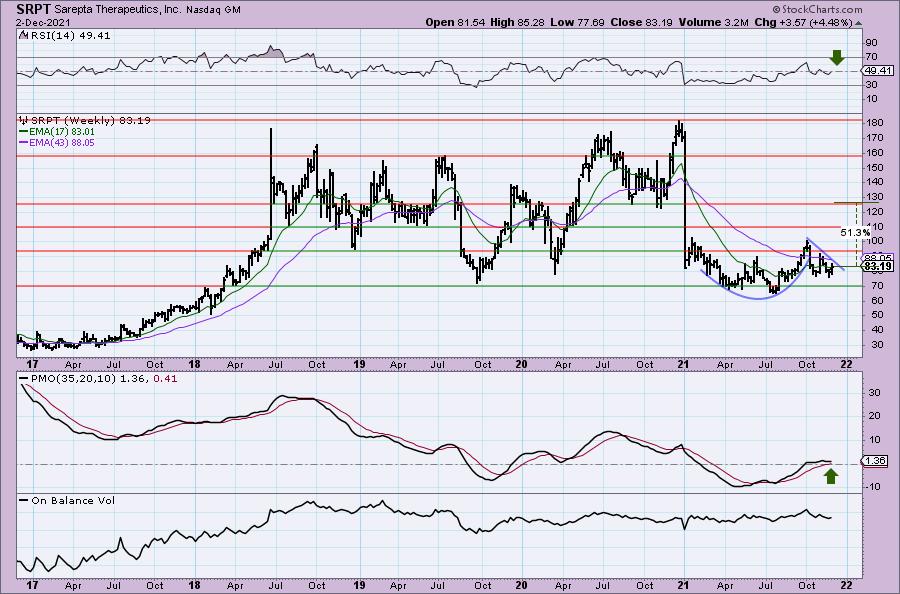
There is a bullish cup with handle pattern, but it hasn't been confirmed with a breakout yet. The weekly RSI is nearing positive territory and the weekly PMO is attempting to turn back up above the signal line and zero line. Upside potential based on the pattern and overhead resistance is over 50%.
Don't forget, on Thursdays I look at reader-requested symbols, click HERE to shoot me an email. I read every email I receive and try to answer them all!
Current Market Outlook:
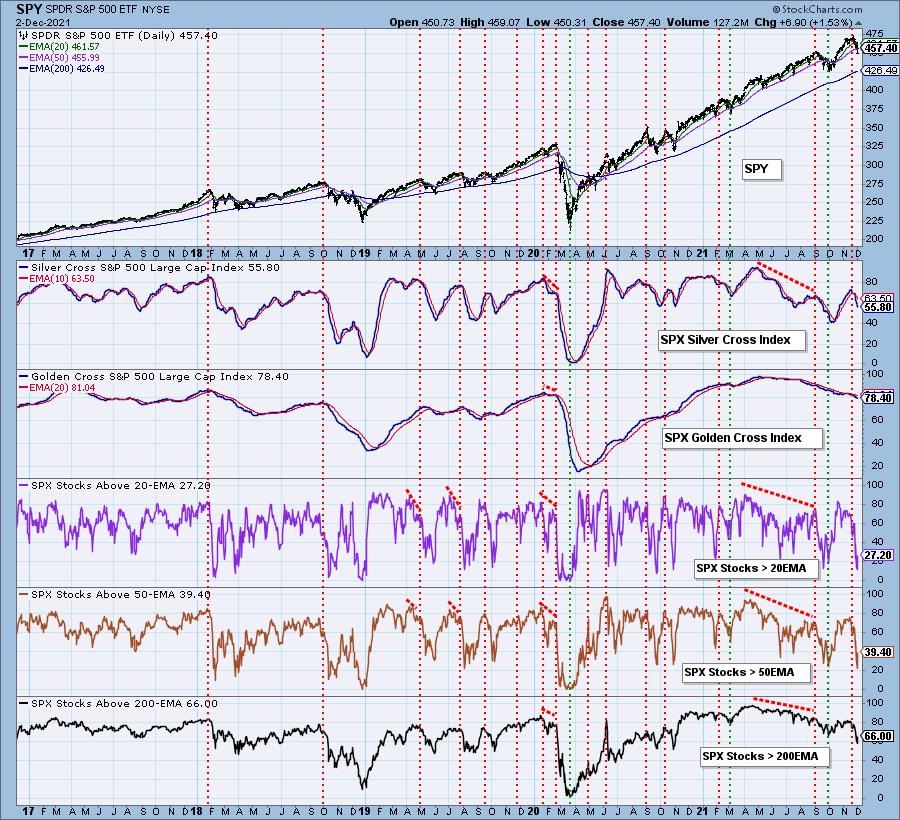
Market Environment: It is important to consider the odds for success by assessing the market tides. The following chart uses different methodologies for objectively showing the depth and trend of participation for intermediate- and long-term time frames.
- The Silver Cross Index (SCI) shows the percentage of SPX stocks on IT Trend Model BUY signals (20-EMA > 50-EMA)
- The Golden Cross Index (GCI) shows the percentage of SPX stocks on LT Trend Model BUY signals (50-EMA > 200-EMA)
- The Bullish Percent Index (BPI) shows the percentage of SPX stocks on Point & Figure BUY signals.
Don't forget that as a "Diamonds" member, you have access to our GCI/SCI curated ChartList on DecisionPoint.com. You'll find it under "Members Only" links on the left side on the Blogs and Links Page.
Here is the current chart:
Full Disclosure: I'm 15% invested and 85% is in 'cash', meaning in money markets and readily available to trade with.
I'm required to disclose if I currently own a stock and/or may buy it within the next 72 hours.
Technical Analysis is a windsock, not a crystal ball.
Happy Charting!
- Erin
erin@decisionpoint.com
Watch the latest episode of DecisionPoint with Carl & Erin Swenlin on Mondays 7:00p EST or on the DecisionPoint playlist on the StockCharts TV YouTube channel here!
NOTE: The stocks reported herein are from mechanical trading model scans that are based upon moving average relationships, momentum and volume. DecisionPoint analysis is then applied to get five selections from the scans. The selections given should prompt readers to do a chart review using their own analysis process. This letter is not a call for a specific action to buy, sell or short any of the stocks provided. There are NO sure things or guaranteed returns on the daily selection of "Diamonds in the Rough."
Helpful DecisionPoint Links:
DecisionPoint Shared ChartList and DecisionPoint Chart Gallery
Price Momentum Oscillator (PMO)
Swenlin Trading Oscillators (STO-B and STO-V)
For more links, go to DecisionPoint.com