
First, out the gate, I apologize that I do not have a complete list of the requests this week. I managed to delete some from ChartLists so I will not be including a "runners-up" list.
I always enjoy seeing what charts are sparking your interest and this week was no exception. One of the industry groups pervading my scans has been Software. I included two Software companies that includes Microsoft (MSFT). I mean if we're going to look at Software, MSFT should be included (plus it was requested!).
It appears that the breakout in Energy and Crude Oil busted. I've shed one of my two Energy related stocks. Definitely reevaluate any Energy positions you have with a dispassionate process. Cognitive bias will generally be a problem if you already own a stock.
See you in tomorrow's Diamond Mine trading room! Remember that links to the recordings and registration are in EVERY Diamond Report. Unfortunately we cannot make this trading room recurring because, believe it or not, we do lose some subscribers periodically and do not want them to continue to have access.
Good Luck & Good Trading!
Erin
Today's "Diamonds in the Rough": BL, CTIC, MSFT, NKLA and RXRX.

RECORDING LINK (7/29/2022):
Topic: DecisionPoint Diamond Mine (7/29/2022) LIVE Trading Room
Start Time: Jul 29, 2022 08:59 AM
Meeting Recording Link
Access Passcode: July#29th
REGISTRATION FOR Friday (8/5/2022) Diamond Mine Trading Room:
When: Aug 5, 2022 09:00 AM Pacific Time (US and Canada)
Topic: DecisionPoint Diamond Mine (8/5/2022) LIVE Trading Room
Register in advance for this webinar HERE
Save the registration confirmation email with login instructions in case Zoom doesn't notify you in time.

StockChartsTV is now producing the recording for the free DP Trading Room! It airs at 3p ET, much sooner than I was able to get out the recording links. Carl has joined so you can "ask the master" all those questions you've always wanted his opinion on! If you haven't registered to attend live at Noon ET, you can do so HERE.
Welcome to DecisionPoint Daily Diamonds, wherein I highlight ten "Diamonds in the Rough" per week. These are selected from the results of my DecisionPoint Scans, which search for stocks that could benefit from the trend and condition of the market. Remember, these are not recommendations to buy or sell, but are the most interesting of the stocks that surfaced in my scans. My objective is to save you the work of the initial, tedious culling process, but you need to apply your own analysis to see if these stocks pique your interest as well. There are no guaranteed winners here!
"Predefined Scans Triggered" are taken from StockCharts.com using the "Symbol Summary" option instead of a "SharpChart" on the workbench.
BlackLine, Inc. (BL)
EARNINGS: 8/4/2022 (AMC) ** Reported Today **
BlackLine, Inc. operates a cloud-based software platform which is designed to transform accounting and finance operations for organizations of all types and sizes. Its scalable platform supports critical accounting processes such as the financial close, account reconciliations, intercompany accounting, and controls assurance. The company was founded by Therese Tucker in May 2001 and is headquartered in Woodland Hills, CA.
Predefined Scans Triggered: Parabolic SAR Buy Signals.
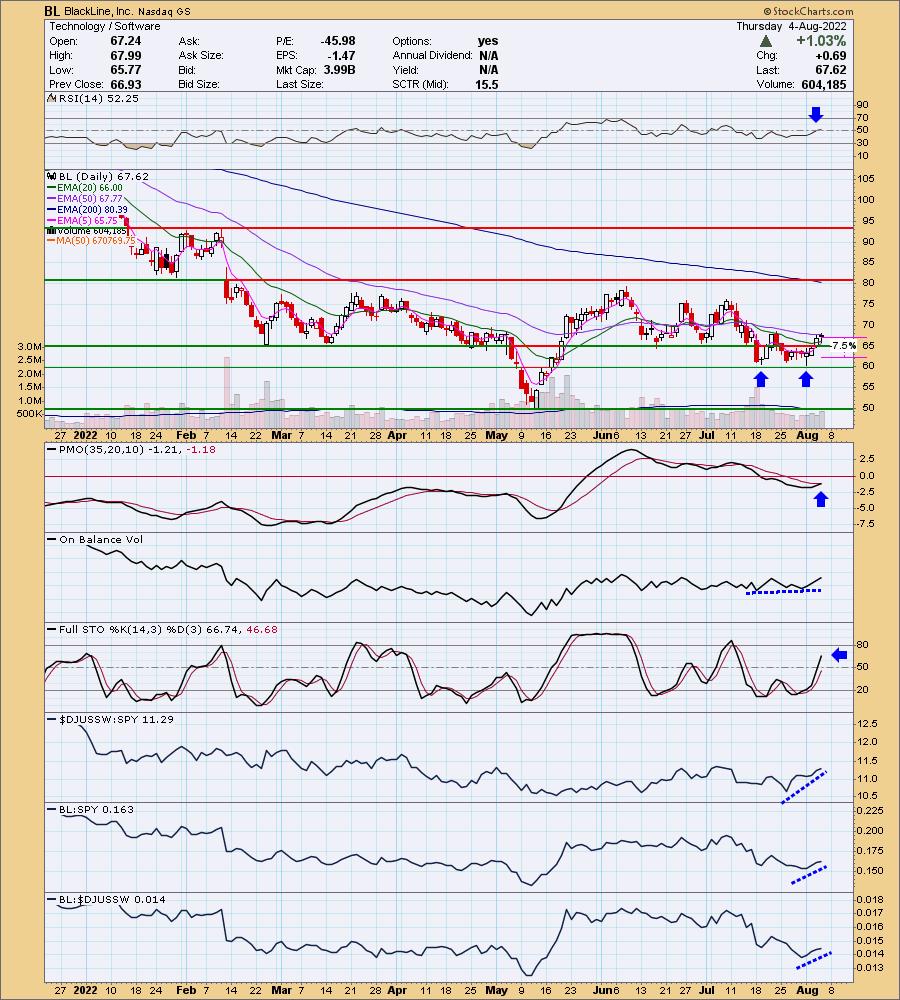
BL reported earnings after the bell and is up +5.59% in after hours trading. I covered September 7th 2021 (position closed). You know how I like price breakouts and we don't quite have one here. I do like the double-bottom set-up, but I generally prefer to wait for the confirmation breakout. The RSI is positive and the PMO is about to give us a crossover BUY signal. The OBV has a slight positive divergence with price given its rising bottoms. Stochastics are positive and rising strongly. Relative strength has been picking up for the group over the past two weeks. I'd like to set the stop below support, but that is pretty deep percentage-wise so I chose to set it around 7.5% or $62.55. Remember these stops are only guidelines.
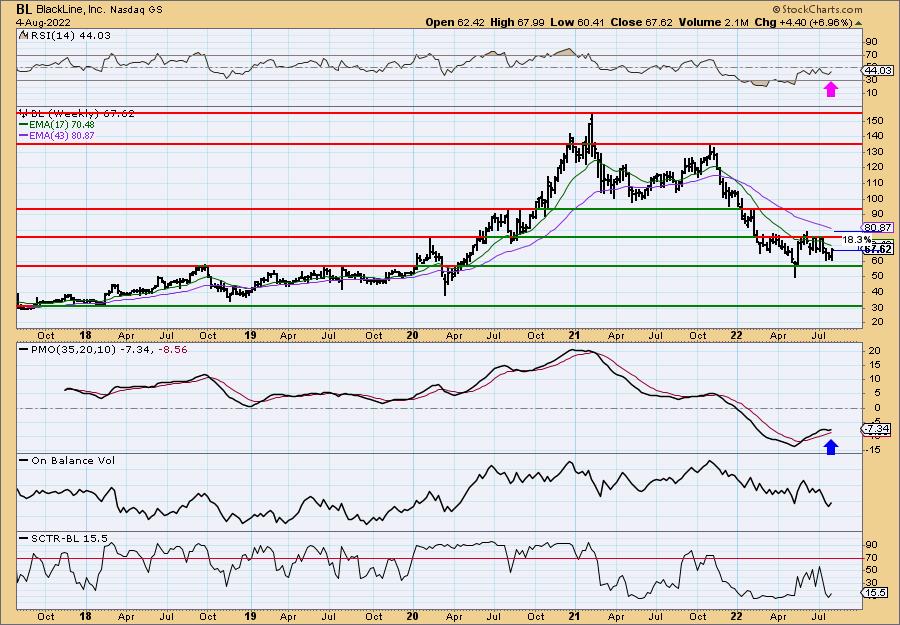
The weekly chart is trying to firm up after the long decline. The weekly PMO had a crossover BUY signal, but then topped. The good news is that it is bottoming above the signal line now. The weekly RSI is still negative and the SCTR is abysmal still.
CTI BioPharma Corp. (CTIC)
EARNINGS: 8/8/2022 (AMC)
CTI BioPharma Corp. is a biopharmaceutical company, which engages in the development, acquisition, and commercialization of novel targeted therapies for blood-related cancers. It focuses on evaluating pacritinib, its sole product candidate currently in active development, for the treatment of adult patients with myelofibrosis. The company was founded by James A. Bianco, Jack W. Singer, and Louis A. Bianco in September 1991 and is headquartered in Seattle, WA.
Predefined Scans Triggered: New 52-week Highs, Stocks in a New Uptrend (ADX), Moved Above Upper Bollinger Band, Stocks in a New Uptrend (Aroon), Moved Above Upper Price Channel and P&F Double Top Breakout.
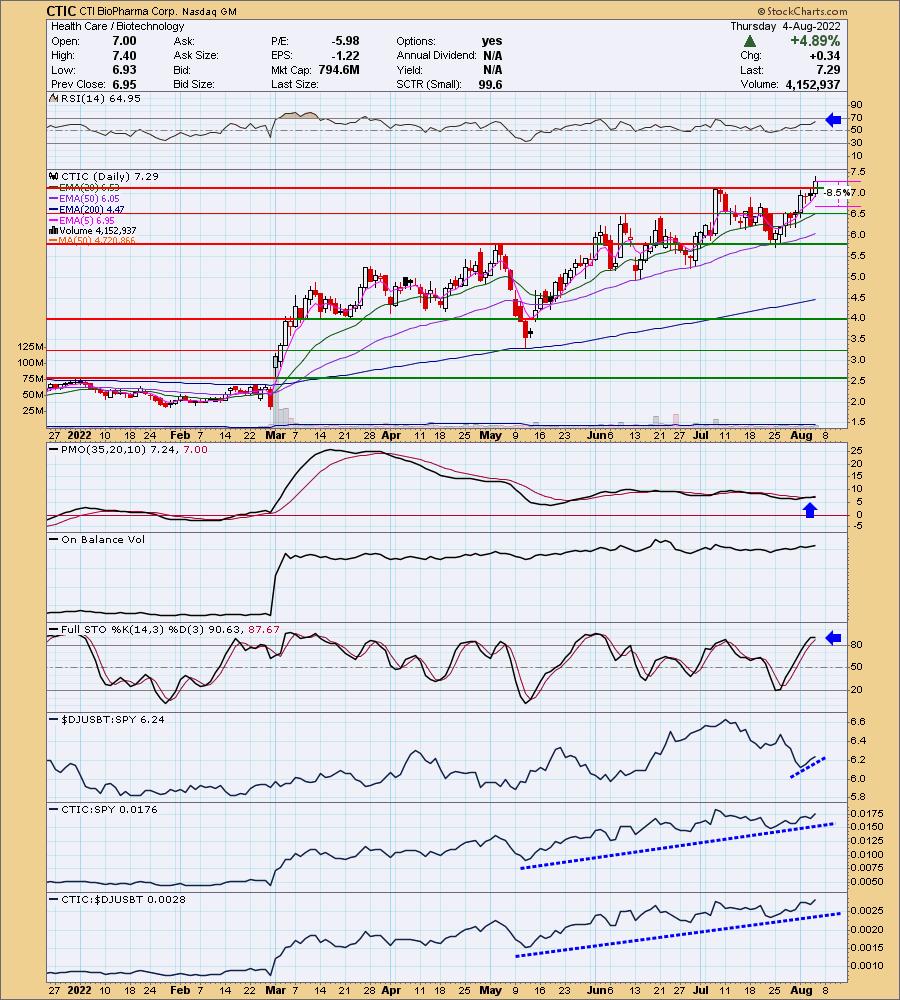
CTIC is down -0.69% in after hours trading. They report earnings next week so keep that in mind. This is a case of "winners keep on winning". It continues to make new 52-week highs. Today's breakout was excellent. The RSI is not overbought even after this nice rally. The PMO has recently triggered a crossover BUY signal. Relative strength for this stock on its own is great, but now the industry group itself is reigniting. Given today's large rally, setting the stop was a bit tricky. I want it below $6.50, but that is too much decline to suck up if this goes wrong. You'll be able to adjust it appropriately if you enter. Current stop level is 8.5% or around $61.87.
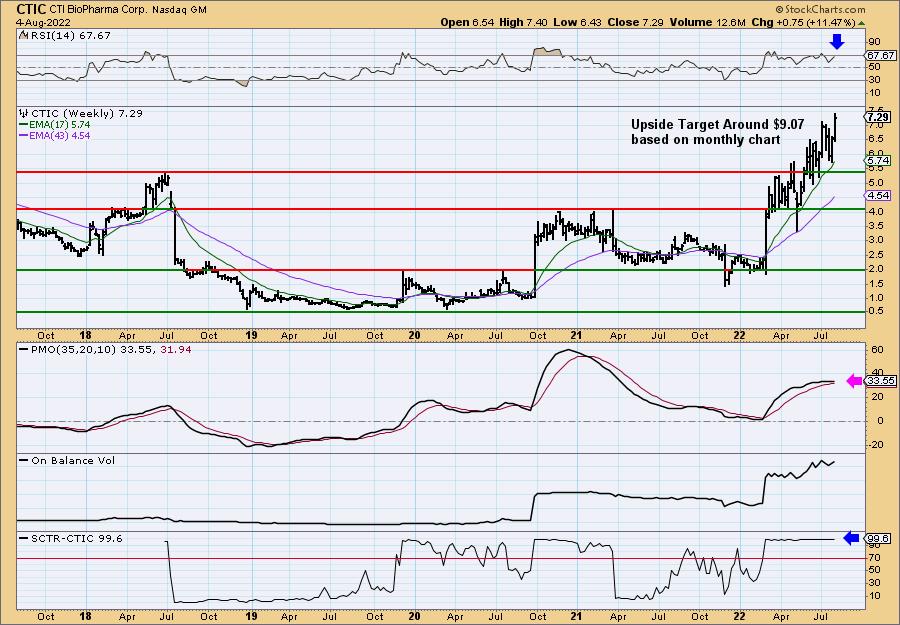
The weekly chart is good, but I'm not thrilled with the look of the PMO. It is flattening more than likely because the rising trend has been steady since this rally began. The RSI is positive and the OBV is confirming with rising bottoms. The SCTR is outstanding at 99.6%. I checked the monthly chart and the next level of resistance is at $9.07.
Microsoft Corp. (MSFT)
EARNINGS: 10/25/2022 (AMC)
Microsoft Corp. engages in the development and support of software, services, devices, and solutions. It operates through the following business segments: Productivity and Business Processes, Intelligent Cloud, and More Personal Computing. The Productivity and Business Processes segment consists of Office Commercial (Office 365 subscriptions, the Office 365 portion of Microsoft 365 Commercial subscriptions, and Office licensed on-premises), Exchange, SharePoint, Microsoft Teams, Office 365 Security and Compliance, and Skype for Business, Office Consumer, including Microsoft 365 Consumer subscriptions, Office licensed on-premises, and other Office services, LinkedIn, including Talent Solutions, Marketing Solutions, Premium Subscriptions, Sales Solutions, and Learning Solutions, Dynamics business solutions, including Dynamics 365, comprising a set of intelligent, cloud-based applications across ERP, CRM, Customer Insights, Power Apps, and Power Automate, and on-premises ERP and CRM applications. The Intelligent Cloud segment consists of Server products and cloud services, including Azure and other cloud services, SQL Server, Windows Server, Visual Studio, System Center, and related Client Access Licenses (CALs), and Nuance and GitHub, Enterprise Services, including Enterprise Support Services, Microsoft Consulting Services, and Nuance professional services. The More Personal Computing segment consists of Windows, including Windows OEM licensing and other non-volume licensing of the Windows operating system, Windows Commercial, comprising volume licensing of the Windows operating system, Windows cloud services, and other Windows commercial offerings, patent licensing, and Windows Internet of Things, Devices, including Surface and PC accessories, Gaming, including Xbox hardware and Xbox content and services, comprising digital transactions, Xbox Game Pass and other subscriptions, video games, third-party video game royalties, cloud services, and advertising, Search and news advertising. The company was founded by Paul Gardner Allen and William Henry Gates, III in 1975 and is headquartered in Redmond, WA.
Predefined Scans Triggered: Moved Above Upper Keltner Channel, P&F Spread Triple Top Breakout and P&F Double Top Breakout.
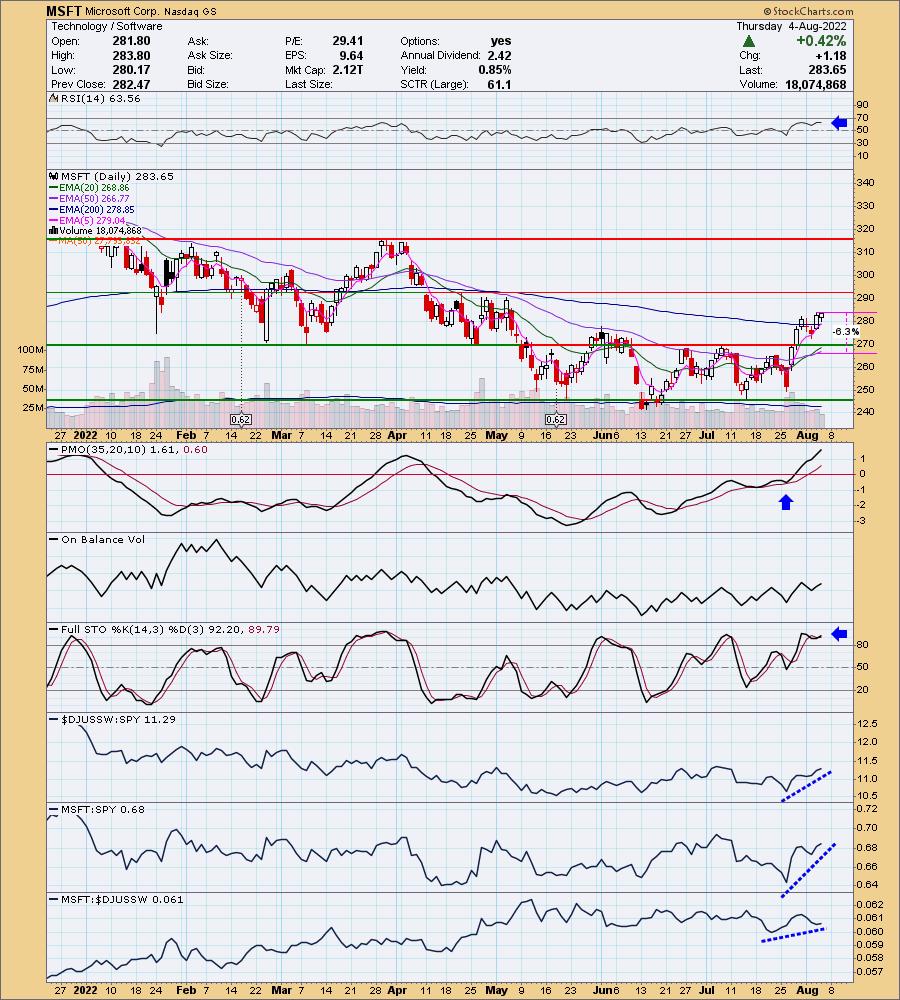
MSFT is up +0.08% in after hours trading. I've covered MSFT numerous times, all in 2020. Last was December 10th 2020 (up +36.46%) Other times: March 10th 2020 (closed), April 17th 2020 (up 142.35%), June 9th 2020 (up 49.45%) and finally on August 25th 2020 (closed).
The set-up is nice particularly given it has overcome resistance at both the 200-day EMA and the June top. More resistance is arriving, but given the positive RSI, rising PMO, strong Stochastics and improving relative strength, it should continue higher. If the market takes a turn for the worse, this will be one of the first to signal problems so be nimble. The stop is set around 6.3% or $265.78.
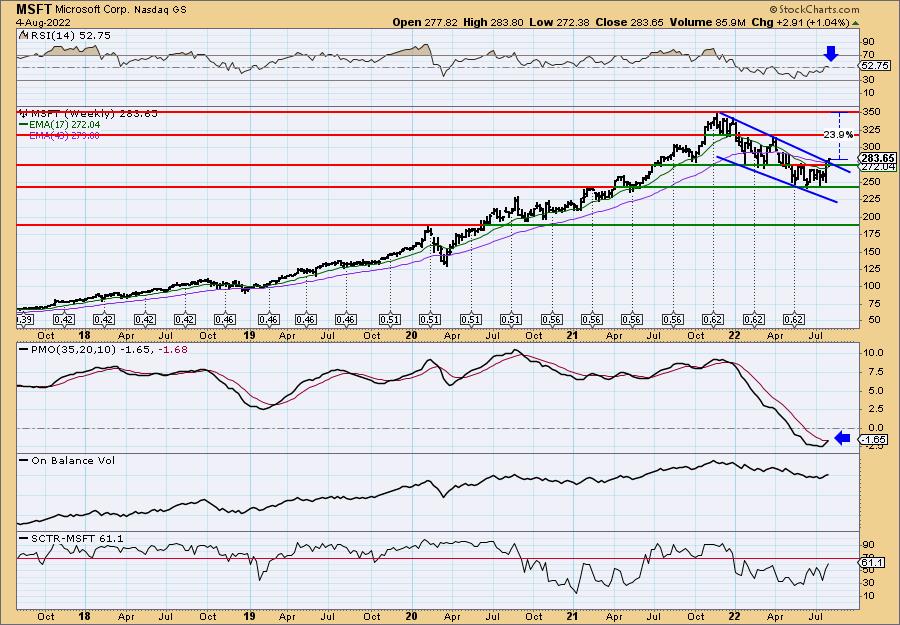
There is a large bullish falling wedge that could also be the flag on a very long multi-year flagpole. The weekly RSI is positive and the weekly PMO has a crossover BUY signal in the making (it won't go final until AMC on Friday). The SCTR is not great, but it's not that bad either. If this breakout sticks, upside potential is about 23.9%.
Nikola Corporation (NKLA)
EARNINGS: 8/4/2022 (BMO) ** Reported Today **
Nikola Corp. engages in the provision of zero-emissions transportation and infrastructure solutions. It designs and manufactures battery-electric and hydrogen-electric vehicles, electric vehicle drivetrains, vehicle components, energy storage systems and hydrogen fueling station infrastructure. The company was founded by Trevor Milton in 2015 and is headquartered in Phoenix, AZ.
Predefined Scans Triggered: P&F Double Top Breakout.
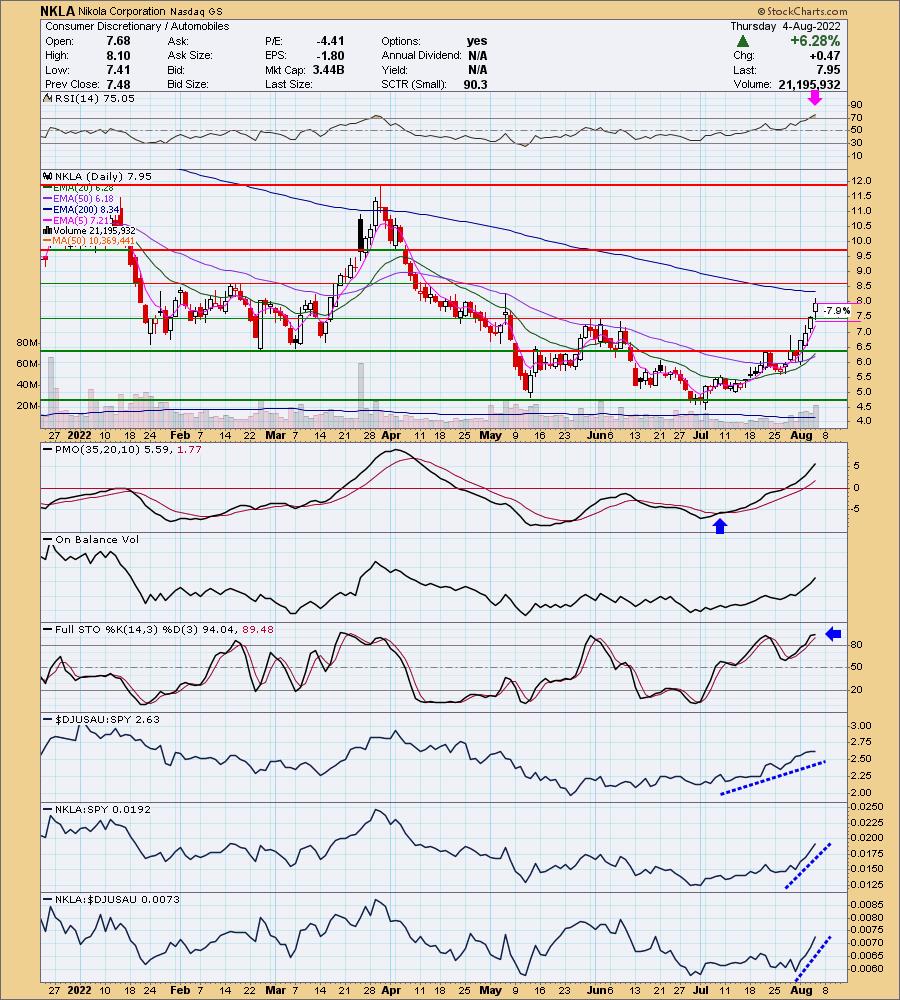
NKLA is down -1.13% in after hours trading. They announced earnings this morning and were up +6.28%. It is due for some digestion as this rally has been near vertical. The RSI is overbought, but still rising. The PMO is rising nicely and isn't overbought yet. Today there was an IT Trend Model "Silver Cross" BUY signal triggered as the 20-day EMA crossed above the 50-day EMA. The breakout above the June highs suggests that it shouldn't have a problem overcoming resistance at the 200-day EMA and February tops. Stochastics are above 80 and relative strength looks excellent. This was our "Industry Group to Watch" last Friday and based on relative strength, it was a good call. The stop is set below support around 7.9% or $7.32.
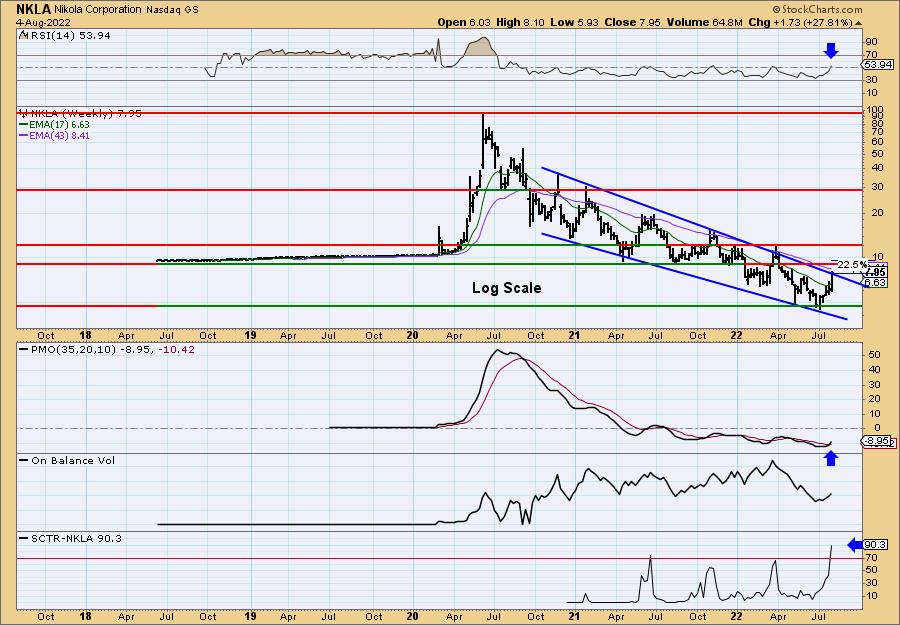
There is a large bullish falling wedge. Price hasn't quite broken out of it, but the indicators suggest this one will be rising more. The weekly RSI just hit positive territory and the weekly PMO will likely trigger a crossover BUY signal at the end of the day tomorrow. The SCTR is outstanding at 90.3%. Upside potential is about 22%.
Recursion Pharmaceuticals Inc. (RXRX)
EARNINGS: 8/12/2022 (AMC)
Recursion Pharmaceuticals, Inc. is a clinical-stage biotechnology company that combines automation, artificial intelligence, machine learning, and in vivo validation capabilities to discover novel medicines. Its Recursion operating system enables advanced machine learning approaches to reveal drug candidates, mechanisms of action, novel chemistry, and potential toxicity, with the eventual goal of decoding biology and advancing new therapeutics that radically improve people's lives. The company was founded by Blake Borgeson, Christopher C. Gibson, and Dean Y. Li on November 5, 2013 and is headquartered in Salt Lake City, UT.
Predefined Scans Triggered: P&F Bullish Catapult, Bearish Harami, Stocks in a New Uptrend (ADX), P&F Ascending Triple Top Breakout and P&F Double Top Breakout.
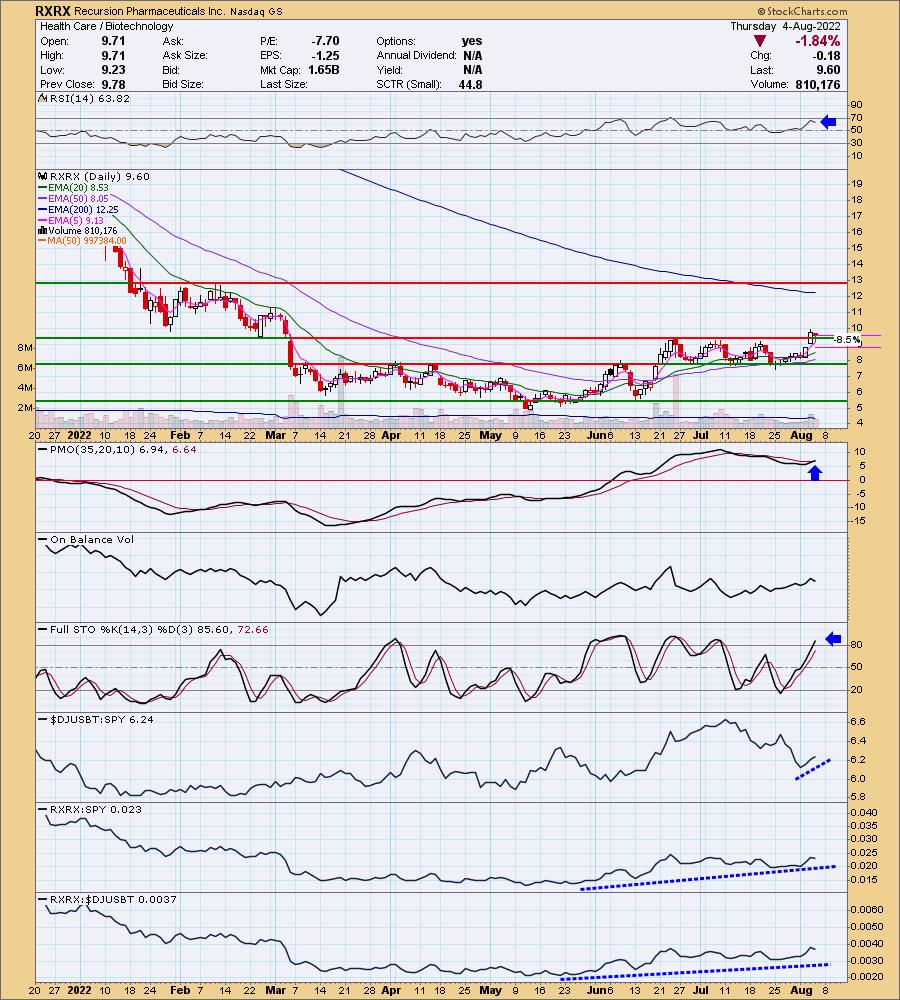
RXRX is up +2.92% in after hours trading. As noted above, Biotechs are starting to show increased relative strength. Fishing in this group isn't easy as there are so many cats and dogs that are very volatile so enter Biotechs with eyes wide open. It also affords us lots of upside potential (and downside potential). We had a breakout yesterday and price held above prior resistance. The RSI is positive and the PMO just triggered a crossover BUY signal. Stochastics are above 80. This one a good relative performer within the group and against the SPY. The stop is set at about 8.5% or $7.27.
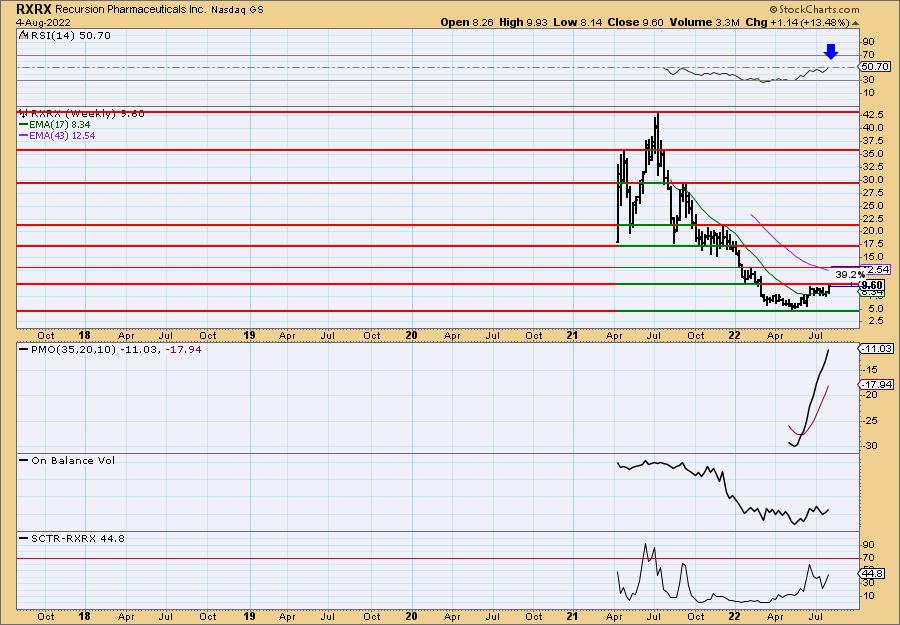
The weekly RSI just hit positive territory. It's really too soon to make any conclusions regarding the PMO given the lack of data, but a breakout here would suggest upside potential at about 39%.
Don't forget, on Thursdays I look at reader-requested symbols, click HERE to send me an email. I read every email I receive and try to answer them all!
Current Market Outlook:
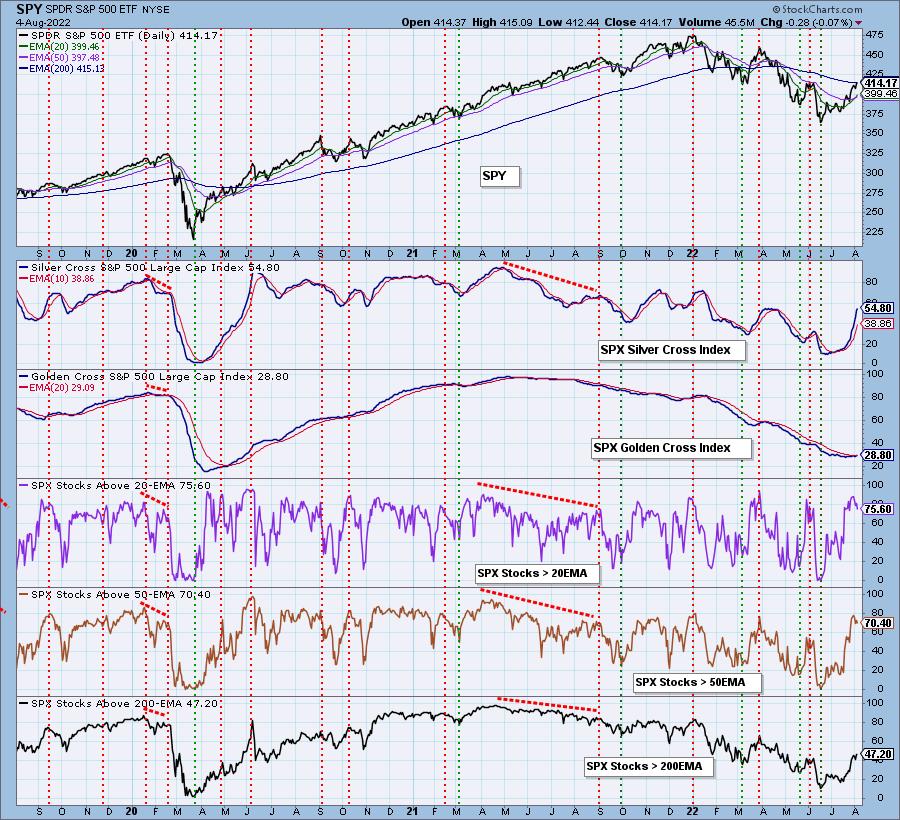
Market Environment: It is important to consider the odds for success by assessing the market tides. The following chart uses different methodologies for objectively showing the depth and trend of participation for intermediate- and long-term time frames.
- The Silver Cross Index (SCI) shows the percentage of SPX stocks on IT Trend Model BUY signals (20-EMA > 50-EMA)
- The Golden Cross Index (GCI) shows the percentage of SPX stocks on LT Trend Model BUY signals (50-EMA > 200-EMA)
Don't forget that as a "Diamonds" member, you have access to our GCI/SCI curated ChartList on DecisionPoint.com. You'll find it under "Members Only" links on the left side on the Blogs and Links Page.
Here is the current chart:
Full Disclosure: I'm 55% exposed. I opted not to expand my portfolio today.
I'm required to disclose if I currently own a stock I mention and/or may buy/short it within the next 72 hours.
"Technical Analysis is a windsock, not a crystal ball." - Carl Swenlin
(c) Copyright 2022 DecisionPoint.com
Watch the latest episode of DecisionPoint with Carl & Erin Swenlin on Mondays 7:00p EST or on the DecisionPoint playlist on the StockCharts TV YouTube channel here!
NOTE: The stocks reported herein are from mechanical trading model scans that are based upon moving average relationships, momentum and volume. DecisionPoint analysis is then applied to get five selections from the scans. The selections given should prompt readers to do a chart review using their own analysis process. This letter is not a call for a specific action to buy, sell or short any of the stocks provided. There are NO sure things or guaranteed returns on the daily selection of "Diamonds in the Rough."
Regarding BUY/SELL Signals: The signal status reported herein is based upon mechanical trading model signals and crossovers. They define the implied bias of the price index based upon moving average relationships and momentum, but they do not necessarily call for a specific action. They are information flags that should prompt chart review. Further, they do not call for continuous buying or selling during the life of the signal. For example, a BUY signal will probably (but not necessarily) return the best results if action is taken soon after the signal is generated. Additional opportunities for buying may be found as price zigzags higher, but the trader must look for optimum entry points. Conversely, exit points to preserve gains (or minimize losses) may be evident before the model mechanically closes the signal.
Helpful DecisionPoint Links:
DecisionPoint Shared ChartList and DecisionPoint Chart Gallery
Price Momentum Oscillator (PMO)
Swenlin Trading Oscillators (STO-B and STO-V)
For more links, go to DecisionPoint.com