
I switched to presenting "Diamonds in the Rough" as short sales rather than longs. When the market trend is down and headed down further, picking longs becomes a very tricky business. Having picked four shorts this week, I am almost certain that we will see lots of green on this week's Recap spreadsheet tomorrow.
However, reader requests came in as longs... well, there is an exception. I don't normally trade "juiced" ETFs, but I was presented with SDOW which is ultrashort on the Dow30. This is certainly a way to profit from a bear market, but remember with it being "ultra", moves to the upside on the SPY could result in a higher losses than normal.
One of today's "Diamonds in the Rough" is Cisco (CSCO), the Technology stock. I'm not recommending CSCO as a BUY today. Actually, it is an excellent example of bottom fishing that is too high risk (at least for me).
One of today's was requested by two separate people, Centennial Resource Development (CDEV), so I had to cover that one.
Today's "Diamonds in the Rough": CDEV, CSCO, OXY, PFE and SDOW.
Stocks to Review (No order): EWZ, CLR, PLBC, STNG, ARCC, DESP, DSKE, ESTE, LBRT and MRO.

RECORDING LINK (1/21/2022):
Topic: DecisionPoint Diamond Mine (1/21/2022) LIVE Trading Room
Start Time: Jan 21, 2022 09:00 AM PT
Meeting Recording Link.
Access Passcode: January#21
REGISTRATION FOR 1/28 Diamond Mine:
When: Jan 28, 2022 09:00 AM Pacific Time (US and Canada)
Topic: DecisionPoint Diamond Mine (1/28/2022) LIVE Trading Room
Register in advance for this webinar HERE.
Save the registration confirmation email with login instructions in case Zoom doesn't notify you in time.

Free DP Trading Room (1/24) RECORDING LINK:
Topic: DecisionPoint Trading Room
Start Time: Jan 24, 2022 09:00 AM PT
Meeting Recording Link.
Access Passcode: January@24
For best results, copy and paste the access code to avoid typos.
Welcome to DecisionPoint Daily Diamonds, wherein I highlight ten "Diamonds in the Rough" per week. These are selected from the results of my DecisionPoint Scans, which search for stocks that could benefit from the trend and condition of the market. Remember, these are not recommendations to buy or sell, but are the most interesting of the stocks that surfaced in my scans. My objective is to save you the work of the initial, tedious culling process, but you need to apply your own analysis to see if these stocks pique your interest as well. There are no guaranteed winners here!
"Predefined Scans Triggered" are taken from the StockCharts.com using the "Symbol Summary" option instead of a "SharpChart" on the workbench.
Centennial Resource Development, Inc. (CDEV)
EARNINGS: 2/22/2022 (AMC)
Centennial Resource Development, Inc. operates as oil and natural gas company. It focuses on the development of unconventional oil and liquids-rich natural gas reserves in the Permian Basin. The company was founded in October 2014 and is headquartered in Denver, CO.
Predefined Scans Triggered: Elder Bar Turned Blue, P&F Ascending Triple Top Breakout and P&F Double Top Breakout.
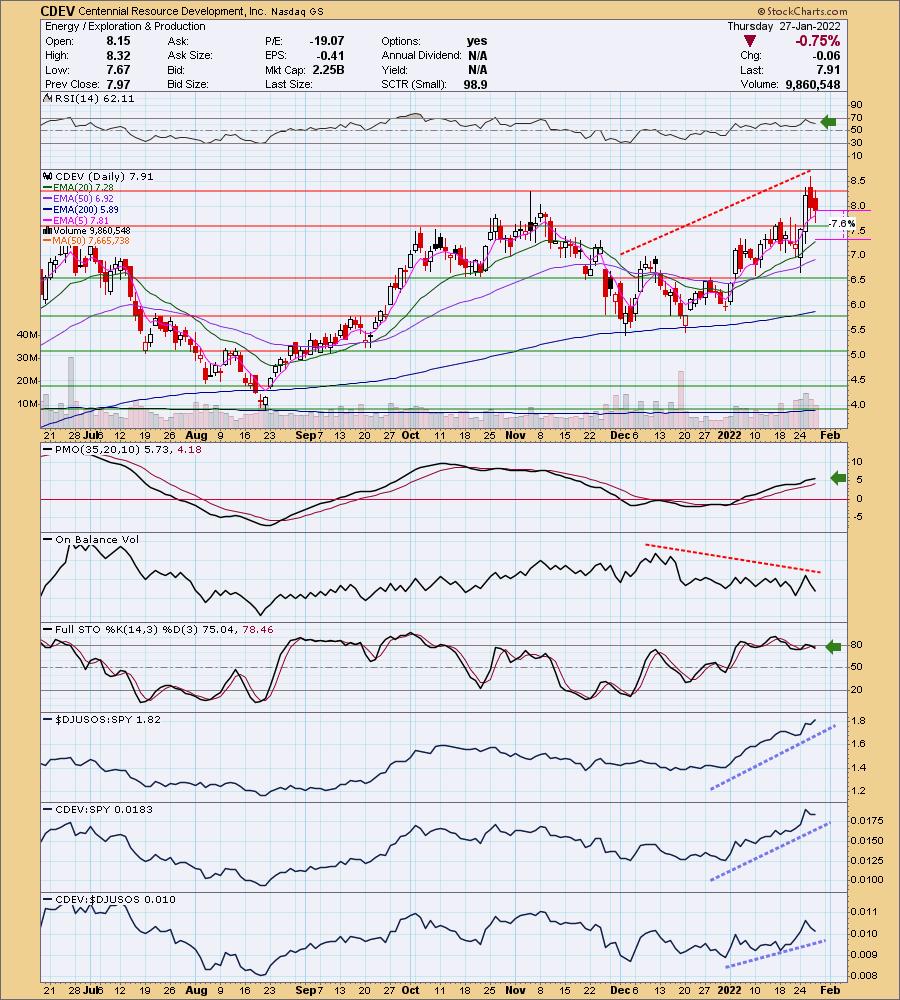
CDEV is unchanged in after hours trading. I like that it is in the Energy sector right off the bat. Good news and bad news here. Let's start with the good news. The RSI is positive and the PMO is rising and not overbought. Stochastics did turn down but remain in positive territory above net neutral (50). Relative strength studies are bullish. The bad news? There is a huge OBV negative divergence. I wouldn't kick CDEV out of bed, but I'd be careful (as with all of your positions, really). I've set the stop at the 20-day EMA.
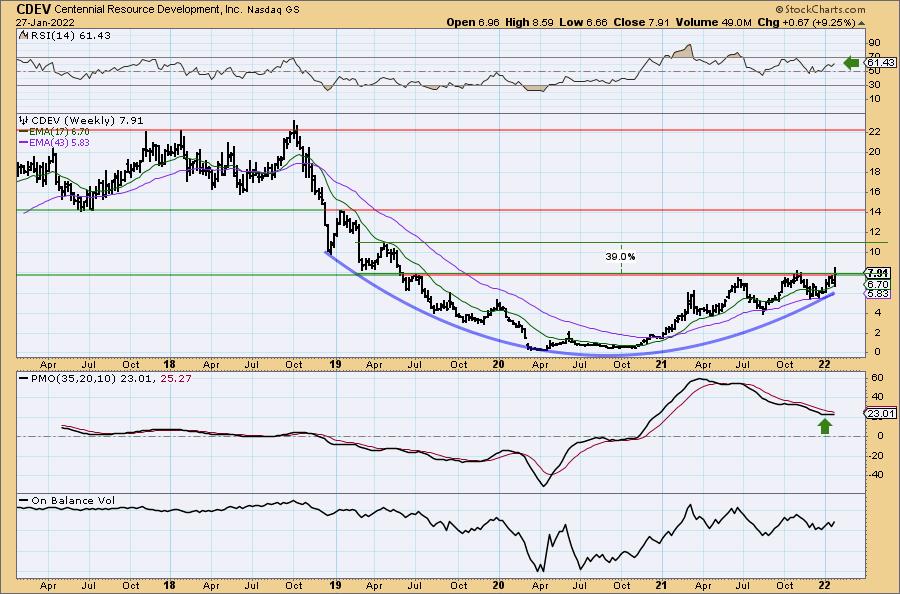
CDEV is trying to push past strong overhead resistance. It has formed a nice price base. The weekly RSI is positive and the weekly PMO appears to be rising. I would really like to see a breakout with some follow-through. If it reaches the next level of overhead resistance, it would give us a nearly 40% gain.
Cisco Systems, Inc. (CSCO)
EARNINGS: 2/16/2022 (AMC)
Cisco Systems, Inc. engages in the design, manufacture, and sale of Internet Protocol-based networking products and services related to the communications and information technology industry. The firm operates through the following geographical segments: the Americas, EMEA, and APJC. Its products include the following categories: Switches, Routers, Wireless, Network Management Interfaces and Modules, Optical Networking, Access Points, Outdoor and Industrial Access Points, Next-Generation Firewalls, Advanced Malware Protection, VPN Security Clients, Email, and Web Security. The company was founded by Sandra Lerner and Leonard Bosack on December 10, 1984 and is headquartered in San Jose, CA.
Predefined Scans Triggered: Moved Below Lower Price Channel and P&F High Pole.
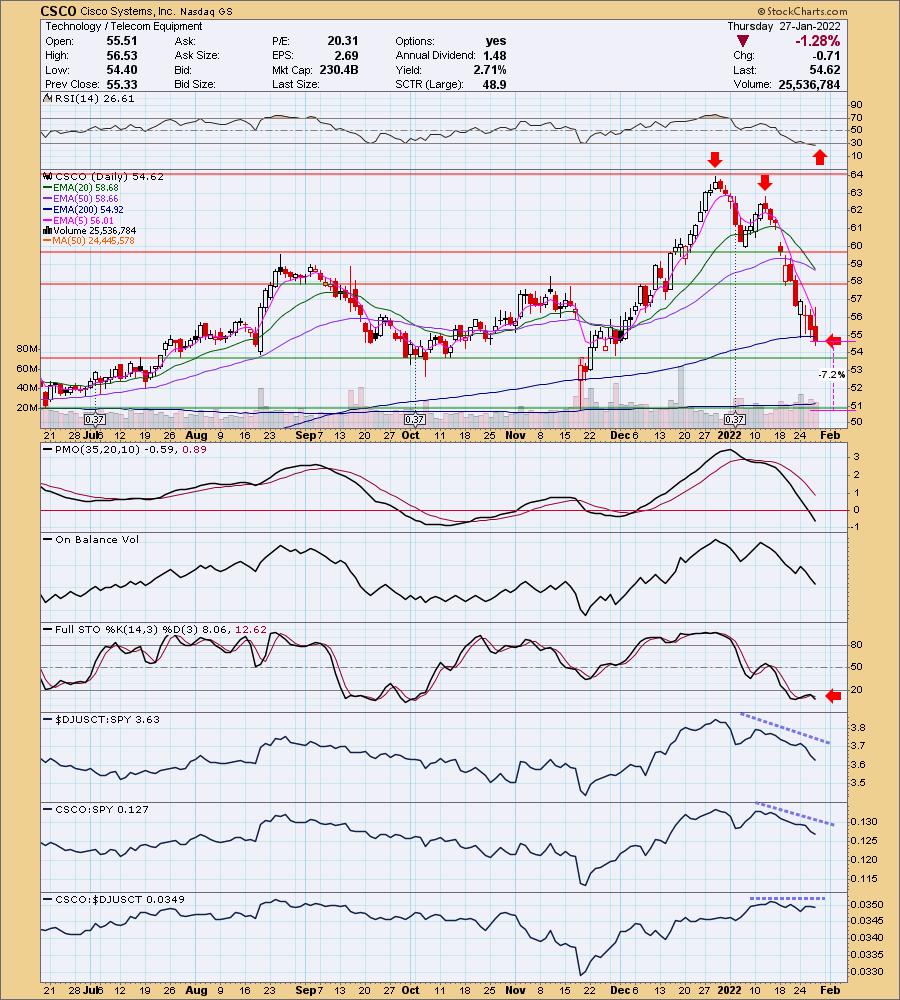
CSCO is up +0.38% in after hours trading. First of all, any of you who know me, know this is not my style of investment. I see where you're going here for the request, price has hit the 200-day EMA and fairly strong support. The RSI is oversold and so are Stochastics. The PMO appears near-term oversold, but I know that the typical range of CSCO's PMO is -2.5 to +2.5, so it is not really oversold at all. (To find the normal PMO range for a particular symbol, set a daily chart to five years. You'll see the range.) Unfortunately, there is still too much of a bearish bias here. We have a "Dark Cross" of the 20/50-day EMAs happening tomorrow and price closed beneath its 200-day EMA. The group is suffering and since CSCO performs in line with the group, it is underperforming the SPY. I wouldn't consider this a short, simply because strong support is available at $51. The stop is set at 7.2%.
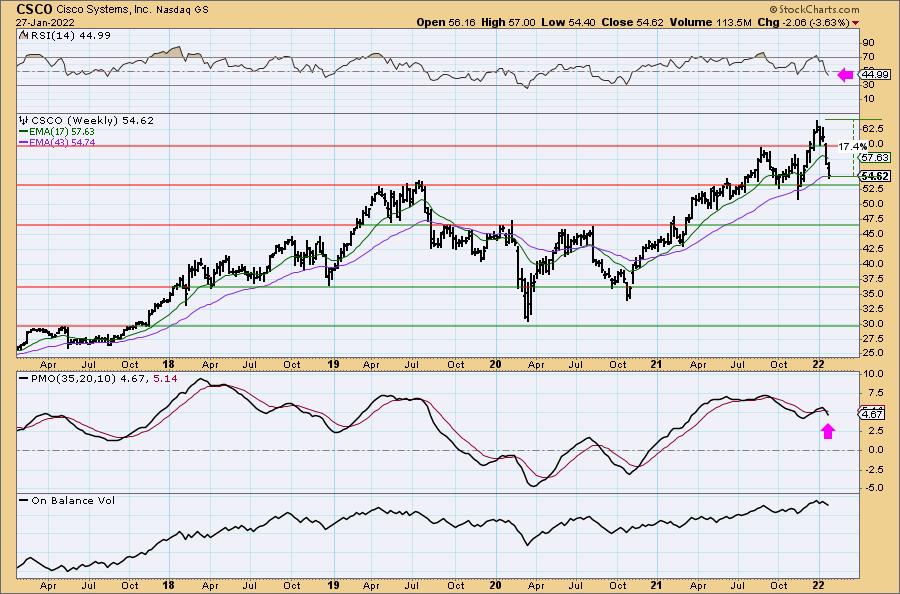
Notice our upside target on the weekly chart is about 17.4%. While that is double our stop level, it seems way too much to ask of a Technology stock to hit new all-time highs right now. Additionally, given the high risk shown on the daily chart, it isn't enough upside potential to entice me. The weekly RSI just hit negative territory and the weekly PMO just triggered a crossover SELL signal. Granted this is a possible support area at the 2019 high, but after a breach of the 43-week EMA and the 200-day EMA on the daily chart, I believe it will move lower.
Occidental Petroleum Corp. (OXY)
EARNINGS: 2/24/2022 (AMC)
Occidental Petroleum Corp. engages in the exploration and production of oil and natural gas. It operates through the following segments: Oil and Gas, Chemical, and Midstream and Marketing. The Oil and Gas segment explores for, develops and produces oil and condensate, natural gas liquids and natural gas. The Chemical segment manufactures and markets basic chemicals and vinyls. The Midstream and Marketing segment purchases, markets, gathers, processes, transports and stores oil, condensate, natural gas liquids, natural gas, carbon dioxide, and power. The company was founded in 1920 and is headquartered in Houston, TX.
Predefined Scans Triggered: New 52-week Highs, Filled Black Candles and P&F Double Top Breakout.
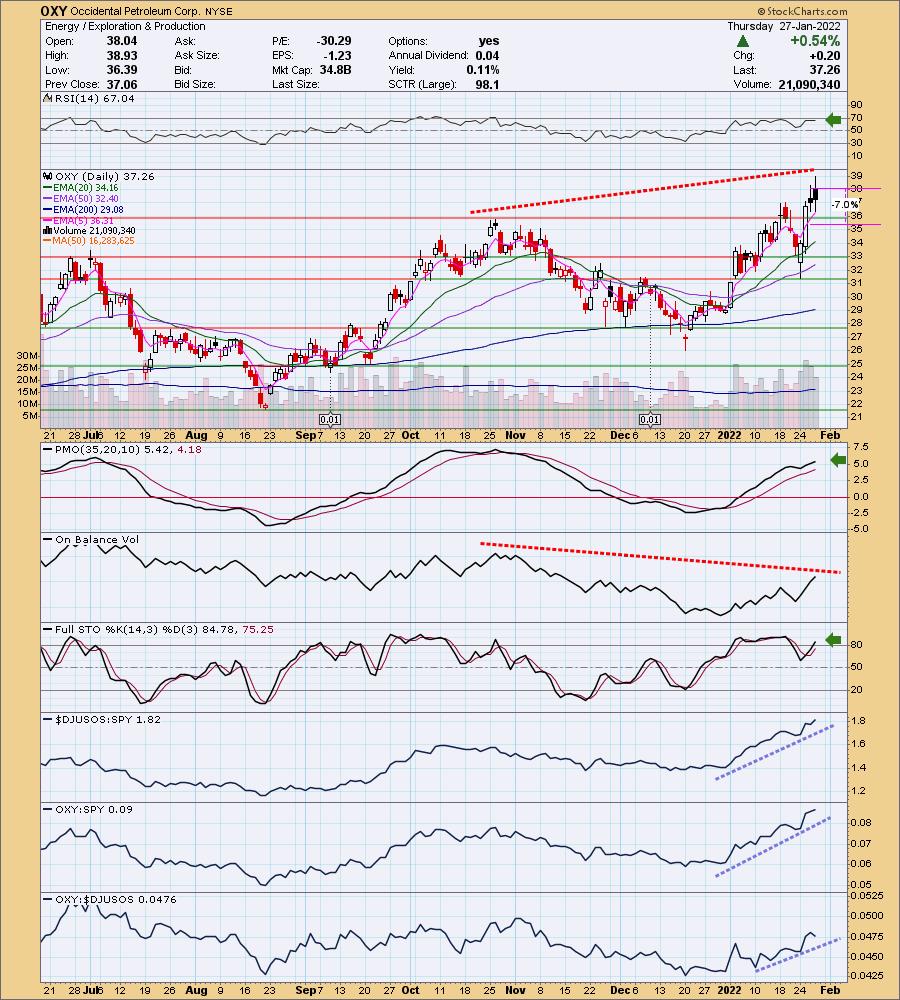
OXY is up +0.32% in after hours trading. I covered OXY twice before. On March 12th 2020 it was a Reader Request that I wasn't fond of. I didn't set a stop level. The second time was on April 28th 2021. The stop hit on that position, but it was up almost 28% in June before the stop hit in August. I imagine none of us would have ridden it down that far after that kind of gain.
This is another good news/bad news stock given the same OBV negative divergence. I must say though, until the OBV tops again, it isn't permanent so it could shake off the divergence if we get more volume on buying. The second we have a down day, the OBV tops and we are stuck with what we have. A very short-term problem is the bearish filled black candlestick; it suggests tomorrow will see price finish lower. Other than all that lol, the chart is excellent. The RSI is positive and not overbought. The PMO is rising and isn't overbought yet. Stochastics are rising and just pushed above 80. Relative strength tells us this is an excellent industry group and OXY is an outperformer in the group itself. The stop is set below support at the October high.
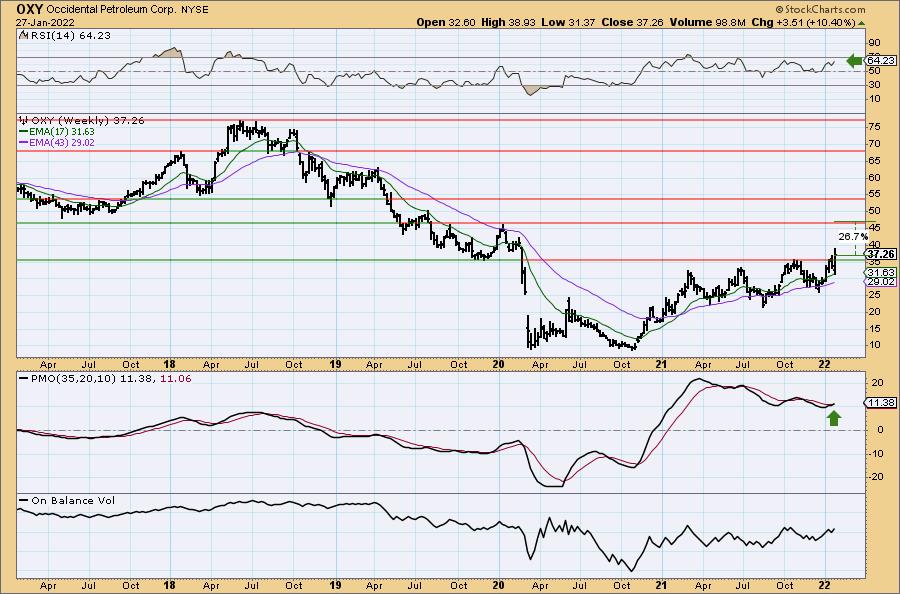
I really like the weekly chart and must say I'm really tempted to open a small position on OXY based on it. The weekly RSI is positive and the weekly PMO just had a positive crossover its signal line. The best part? The strong breakout above strong overhead resistance this week. If it can hit the 2020 high that's a 26%+ gain.
Pfizer, Inc. (PFE)
EARNINGS: 2/8/2022 (BMO)
Pfizer Inc. is a research-based global biopharmaceutical company. It engages in the discovery, development, manufacture, marketing, sales and distribution of biopharmaceutical products worldwide. The firm work across developed and emerging markets to advance wellness, prevention, treatments and cures that challenge the most feared diseases. The company was founded by Charles Pfizer Sr. and Charles Erhart in 1849 and is headquartered in New York, NY.
Predefined Scans Triggered: Shooting Star.
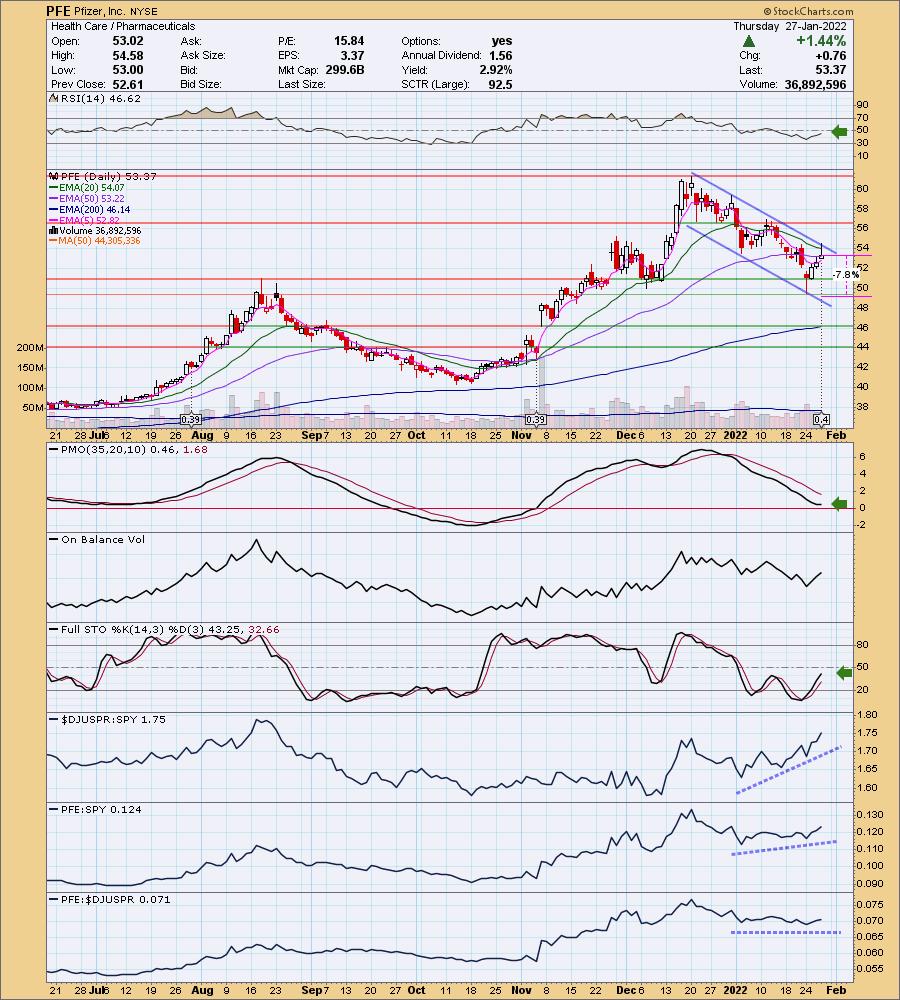
PFE is up +0.17% in after hours trading. I covered PFE three times before on January 12th 2021 (position stopped out quickly), March 3rd 2021 (position is still open and up 55.2%) and July 21st 2021 (position is still open and up +30.1%).
This one needs a day or two more as I want to see a breakout from the current declining trend channel. The chart is really shaping up. The RSI is rising toward positive territory. The PMO is turning up just above the zero line which implies internal strength. Stochastics are rising toward positive territory. Relative strength for the group has really been improving. PFE is performing in line with the group, but is barely outperforming the SPY right now. The stop is set below the August top and this week's low.
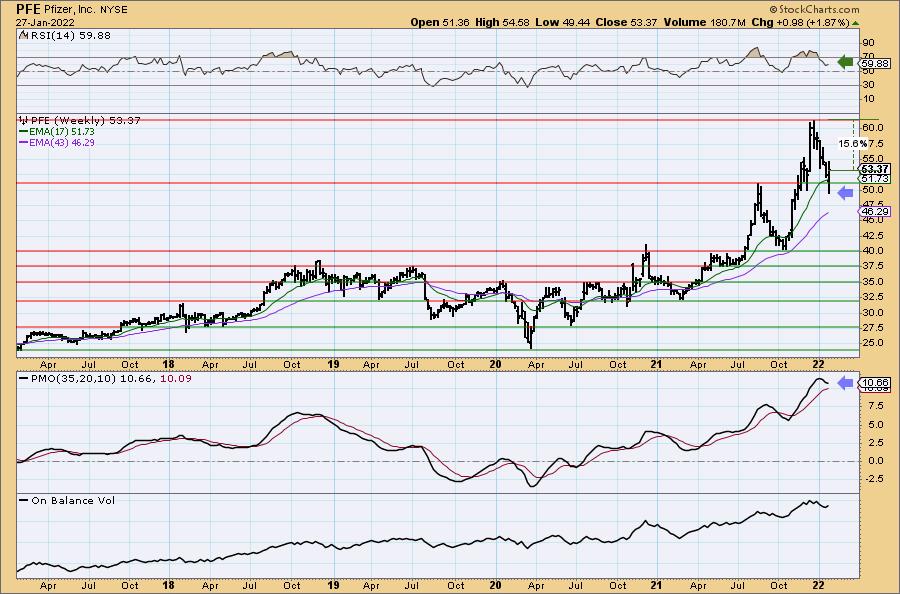
Price is certainly in an area of interest on the weekly chart. It needs to close above the August top given the dip below. The weekly RSI is positive and not overbought and the weekly PMO is trying to turn back up. At this point upside potential is thin at 15.6%. It is again, hard to imagine in this market environment that PFE will hit all-time highs. I would want to give PFE another day or two to make sure we get the breakout from the declining trend channel and get a close tomorrow above the August top.
ProShares UltraPro Short Dow30 (SDOW)
EARNINGS: N/A
SDOW provides 3x inverse exposure to the price-weighted Dow Jones Industrial Average, which includes 30 of the largest US companies.
Predefined Scans Triggered: None.
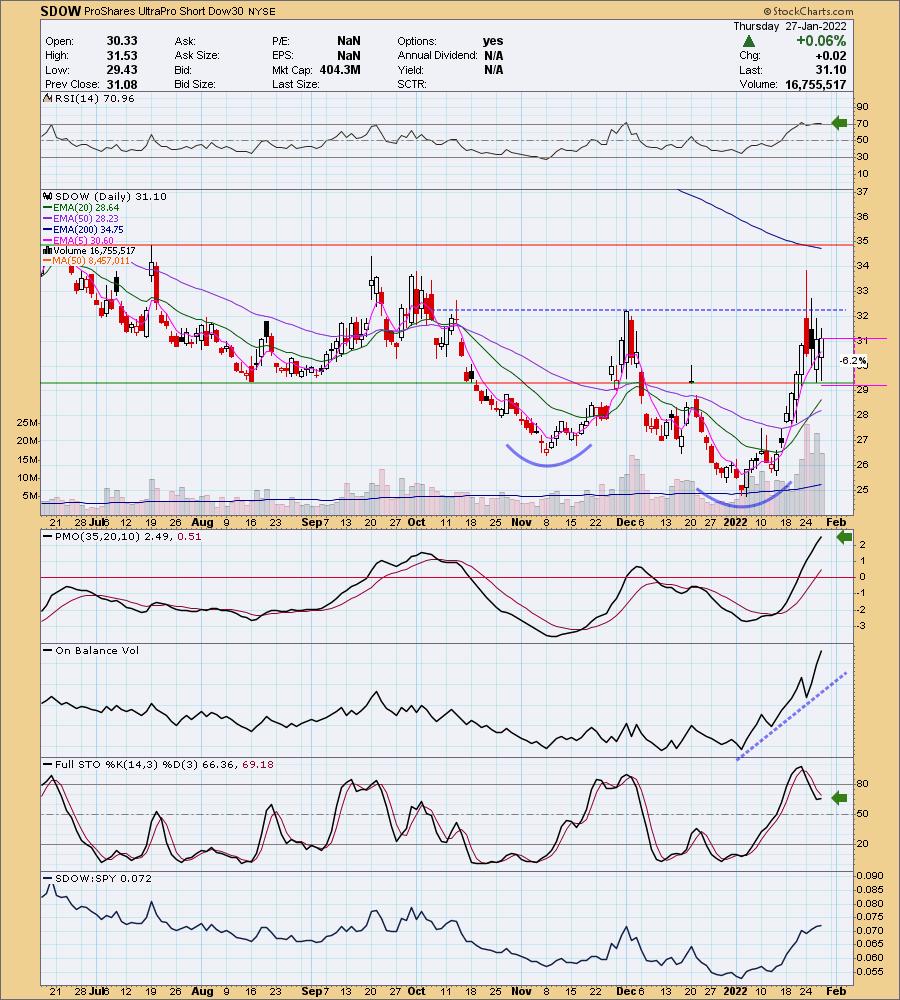
SDOW is down -1.54% in after hours trading. That is an example of how volatile this ETF can be. However, I can't ignore how favorable the daily chart is. There is a large double-bottom pattern. Unfortunately it didn't break above the confirmation line on its last try, but it is bouncing off support at the August low. There is a recent IT Trend Model "Silver Cross" BUY signal, triggered when the 20-day EMA crossed above the 50-day EMA. The RSI is positive, but slightly overbought. The PMO is definitely overbought, but doesn't look interested in moving lower. Stochastics are ticking back up in positive territory. Volume is flying into this ETF as nervous investors quickly hedge their bets. Obviously it is outperforming. The stop is set at -6.2%, below the August low.
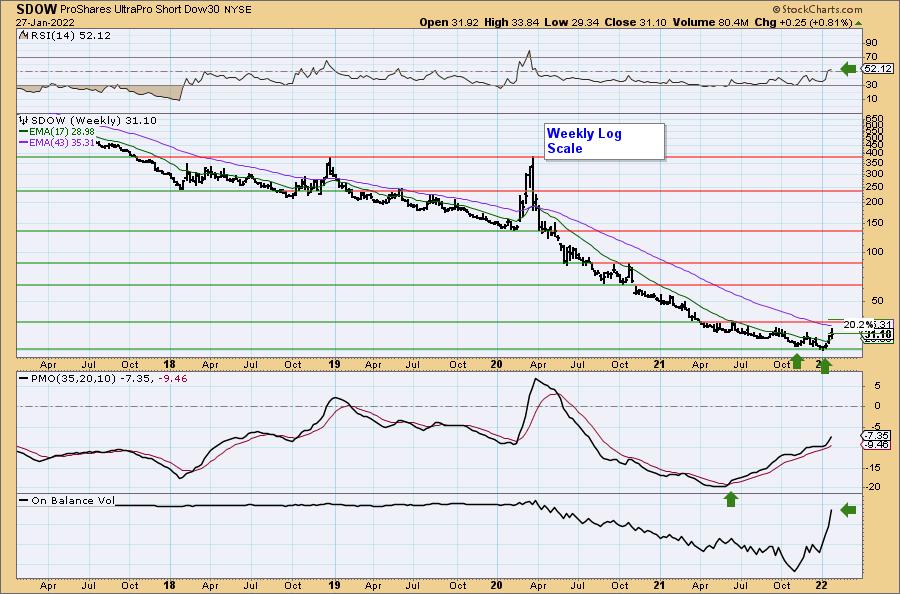
I had to move the weekly chart into a log scale as the past two years of price action was impossible to decipher. You can see the double-bottom pattern. The weekly RSI just moved into positive territory. The weekly PMO is on a BUY signal and recent bottomed above its signal line which is especially bullish. If it can reach above 2nd quarter tops that would be a little over 20% gain. Just be very careful with juiced ETFs.
Don't forget, on Thursdays I look at reader-requested symbols, click HERE to shoot me an email. I read every email I receive and try to answer them all!
Current Market Outlook:
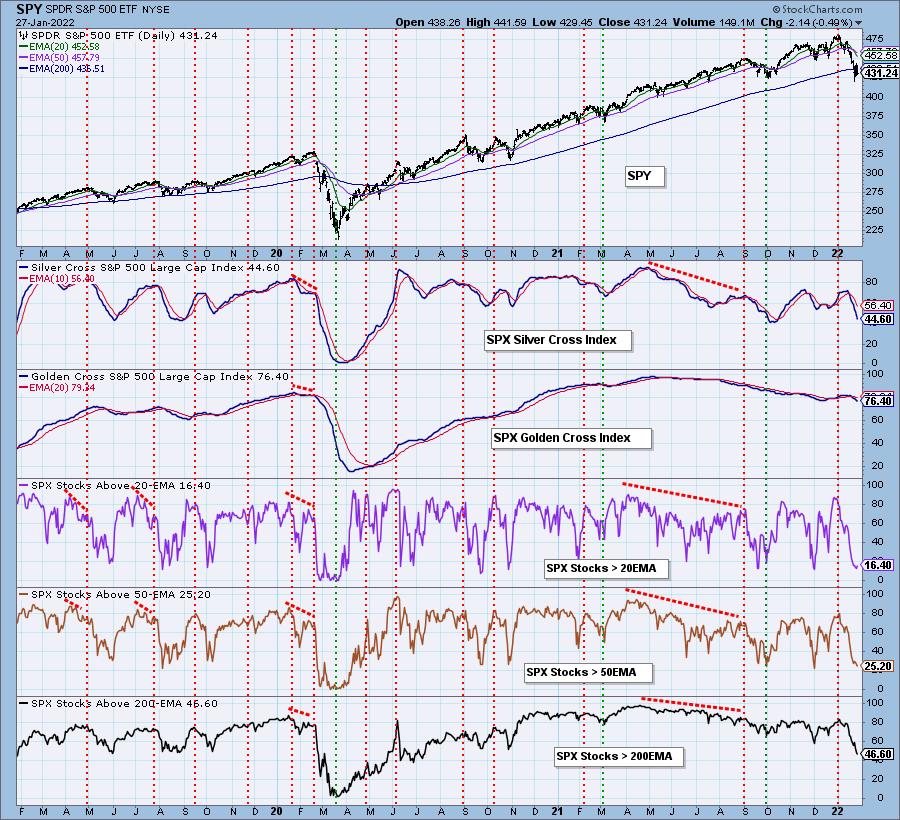
Market Environment: It is important to consider the odds for success by assessing the market tides. The following chart uses different methodologies for objectively showing the depth and trend of participation for intermediate- and long-term time frames.
- The Silver Cross Index (SCI) shows the percentage of SPX stocks on IT Trend Model BUY signals (20-EMA > 50-EMA)
- The Golden Cross Index (GCI) shows the percentage of SPX stocks on LT Trend Model BUY signals (50-EMA > 200-EMA)
Don't forget that as a "Diamonds" member, you have access to our GCI/SCI curated ChartList on DecisionPoint.com. You'll find it under "Members Only" links on the left side on the Blogs and Links Page.
Here is the current chart:
Full Disclosure: I'm 8% invested and 92% is in 'cash', meaning in money markets and readily available to trade with. I now hold only three positions--two in Energy and GLD. I won't lie, I'm considering OXY, but more than likely I will tame my "FOMO" emotions (Fear of Missing Out) and remember Bear Market Rules--oversold conditions are "thin ice" in a bear market, manage long-term positions as short-term and chart patterns tend to resolve downward regardless. We simply can't "expect" bullish conclusions when the market is this internally weak.
I'm required to disclose if I currently own a stock and/or may buy it within the next 72 hours.
Happy Charting!
- Erin
"Technical Analysis is a windsock, not a crystal ball." - Carl Swenlin
(c) Copyright 2022 DecisionPoint.com
Watch the latest episode of DecisionPoint with Carl & Erin Swenlin on Mondays 7:00p EST or on the DecisionPoint playlist on the StockCharts TV YouTube channel here!
NOTE: The stocks reported herein are from mechanical trading model scans that are based upon moving average relationships, momentum and volume. DecisionPoint analysis is then applied to get five selections from the scans. The selections given should prompt readers to do a chart review using their own analysis process. This letter is not a call for a specific action to buy, sell or short any of the stocks provided. There are NO sure things or guaranteed returns on the daily selection of "Diamonds in the Rough."
Helpful DecisionPoint Links:
DecisionPoint Shared ChartList and DecisionPoint Chart Gallery
Price Momentum Oscillator (PMO)
Swenlin Trading Oscillators (STO-B and STO-V)
For more links, go to DecisionPoint.com