
The reader requests that flowed into my email contained some excellent educational charts, not necessarily actionable. One reader requested a short position so I'll cover that. It may surprise you as to which one it is. My pick for the week is a well-known stock that should definitely be added to a watch list.
As I noted yesterday, the pullback has likely begun. When entering new positions, we need to apply more consideration than normal given market weakness. It comes down to your appetite for risk. If the market does pullback, there are always areas of the market where there is strength (Gold and Gold Miners are a current example in my opinion). We could be investing against the trend right now and that opens us up to more risk since the majority of stocks are in decline.
Diamond Mine Trading Room is on tomorrow! Be sure to sign up below.
Today's "Diamonds in the Rough" are: AAPL, GNUS, MSFT, PTON and THQ.
 Diamond Mine Information:
Here is Friday's (12/4) recording link. Use Access Passcode: FrA8@Q9=
Register in advance for the next "DecisionPoint Diamond Mine" trading room on Friday (12/11/2020) 12:00p ET:
Here is the registration link for Friday, 12/11/2020. Password: holiday
Please do not share these links! They are for Diamonds subscribers ONLY!

It's Free!
***Click here to register for this recurring free DecisionPoint Trading Room on Mondays at Noon ET!***
Did you miss the 12/7 free trading room? Here is a link to the recording. Access Code: fNN=Q8h9
For best results, copy and paste the access code to avoid typos.
Welcome to DecisionPoint Daily Diamonds, wherein I highlight five "diamonds in the rough." These are selected from the results of my DecisionPoint scans, which search for stocks that could benefit from the trend and condition of the market. Remember, these are not recommendations to buy or sell, but are the most interesting of the stocks that surfaced in my scans. My objective is to save you the work of the initial, tedious culling process, but you need to apply your own analysis to see if these stocks pique your interest as well. There are no guaranteed winners here!
Apple, Inc. (AAPL)
EARNINGS: 1/26/2021 (AMC)
Apple, Inc. engages in the design, manufacture, and sale of smartphones, personal computers, tablets, wearables and accessories, and other variety of related services. It operates through the following geographical segments: Americas, Europe, Greater China, Japan, and Rest of Asia Pacific. The Americas segment includes North and South America. The Europe segment consists of European countries, as well as India, the Middle East, and Africa. The Greater China segment comprises of China, Hong Kong, and Taiwan. The Rest of Asia Pacific segment includes Australia and Asian countries. Its products and services include iPhone, Mac, iPad, AirPods, Apple TV, Apple Watch, Beats products, Apple Care, iCloud, digital content stores, streaming, and licensing services. The company was founded by Steven Paul Jobs, Ronald Gerald Wayne, and Stephen G. Wozniak in 1977 and is headquartered in Cupertino, CA.
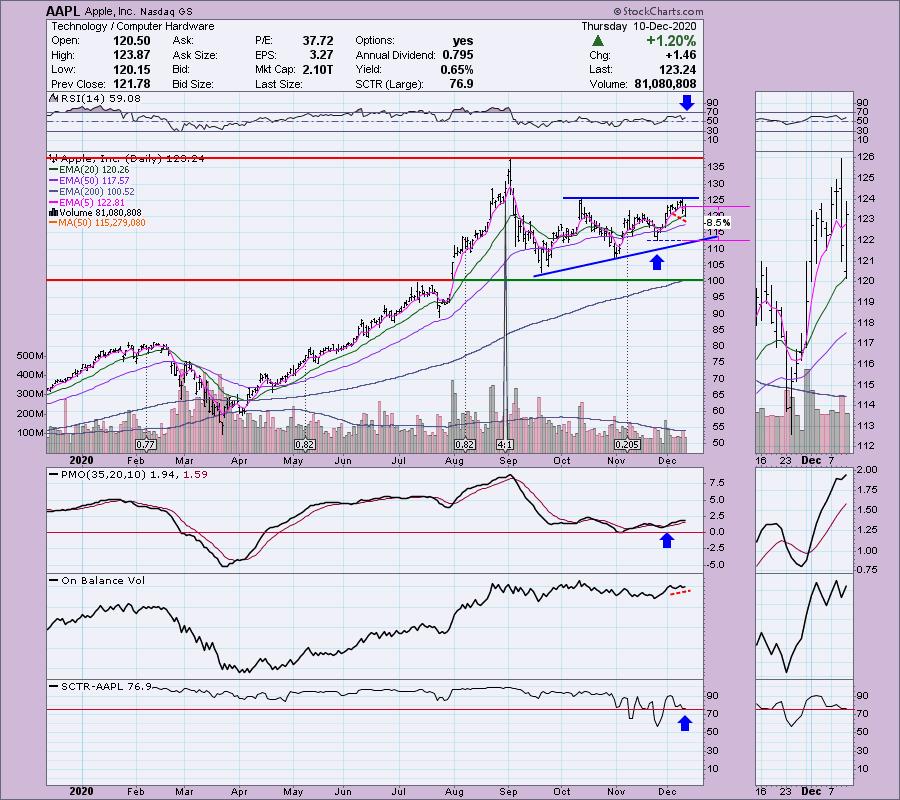
This is my pick. It is very worthy to be in your watch list. Yes, the market is weak and this one usually follows and drives the market. This is why I would definitely put it on my watch list, but not necessarily in my portfolio just yet (remember I'm not adding anything to my portfolio right now). I have to say after spending well over $1000 on Apple products for Christmas, I have to believe they will have a very successful holiday season. That will translate into higher prices.
I covered Apple on March 3rd as a watch list addition. At the time I wasn't recommending entering the market and in that article I even discussed that I wasn't completely comfortable even recommending shorts. I also covered it on May 4th which was an excellent entry overall. Currently AAPL has formed a bullish ascending triangle. Notice that the last low never tested the bottom of the triangle, that is a bullish sign. I suspect we may see price test the 50-EMA or just below before it breaks out of this ascending triangle. If I'd seen this chart yesterday, I would've been somewhat bearish based on the topping PMO, but today the PMO turned back up above the signal line which is generally especially bullish. The RSI is positive and there is a very short-term positive divergence between OBV bottoms and price bottoms (best seen in the thumbnail). The SCTR is managing to hang just above 75.
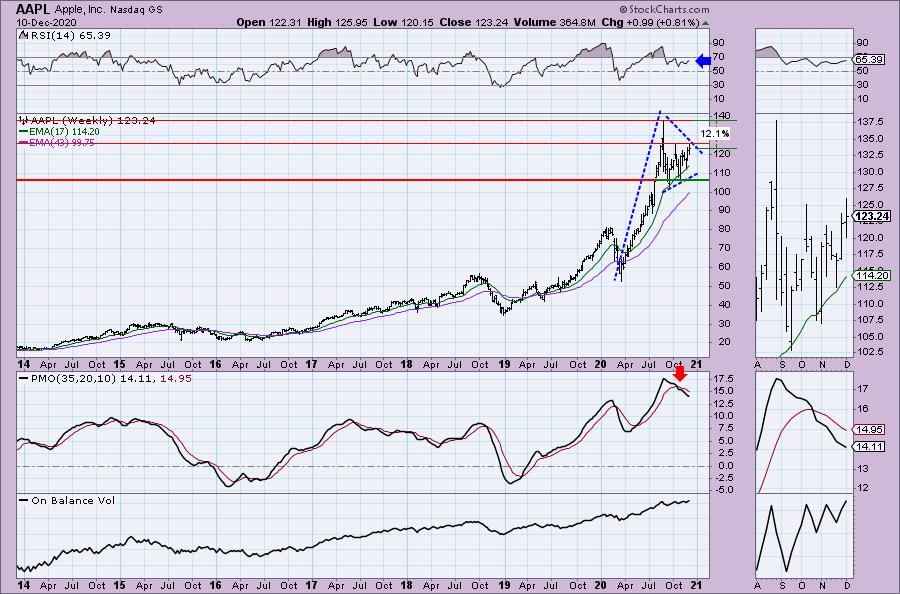
The weekly PMO is on a SELL signal. It is beginning to decelerate which is positive. The RSI is positive and not overbought. I see a pennant sitting on top of a flagpole. That's a very bullish chart pattern.
Genius Brands International, Inc. (GNUS)
EARNINGS: 3/29/2021 (AMC)
Genius Brands International, Inc. is a content and brand management company, which engages in developing, producing, marketing, and licensing branded children's entertainment properties and consumer products for media distribution and retail channels. The firm acts as a licensing agent for certain brands, such as Llama Llama, Psycho Bunny, From Frank, and Celessence Technologies. The company was founded by Balaban Howard Alan on January 2, 2006 and is headquartered in Beverly Hills, CA.
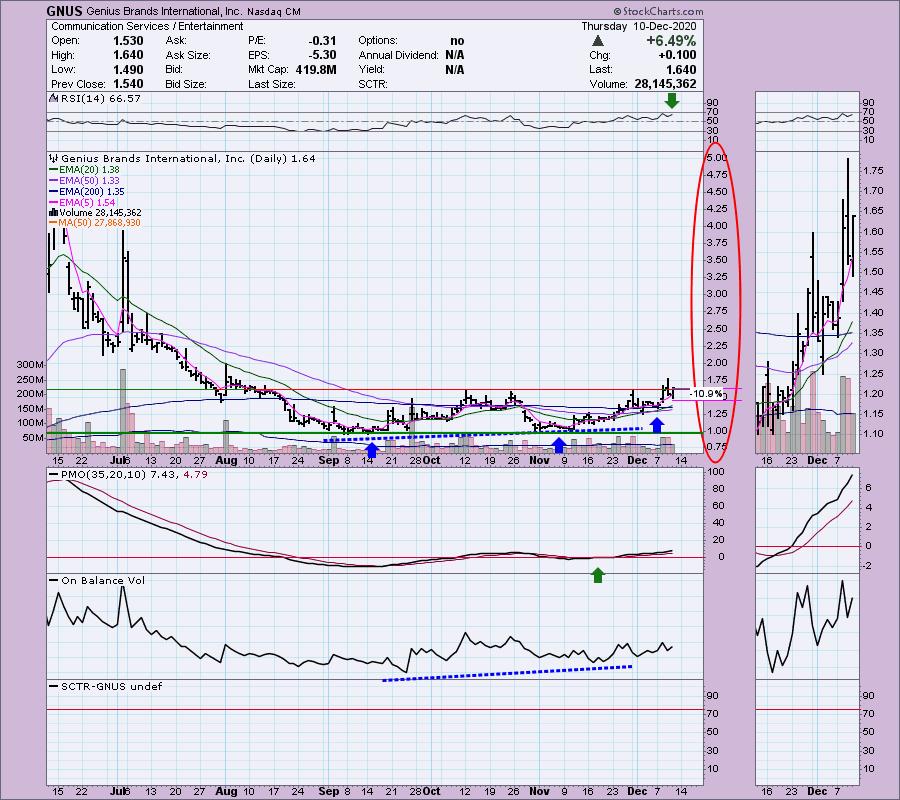
Before I even get started on this one, I want to warn you that it is a very low priced stock and therefore, very high risk. Volatility can kill you on these unless you have a strong stomach or a very small position. This was a request; my scans require a $10 price point or above. I had to cover it though. The chart looks really interesting and the analysis can be applied to any stock. There is a double-bottom on the 6-month bar chart. Price attempted to execute the pattern yesterday but failed. It tried again today and did manage to close slightly above. It closed on its high for the day which does suggest we should see some follow-through. The PMO is rising and is on a BUY signal. The third blue arrow is pointing to the recent 20/50-EMA positive crossover which gives us an IT Trend Model BUY signal. The RSI is positive and you can see that OBV bottoms were in line with the double-bottom.
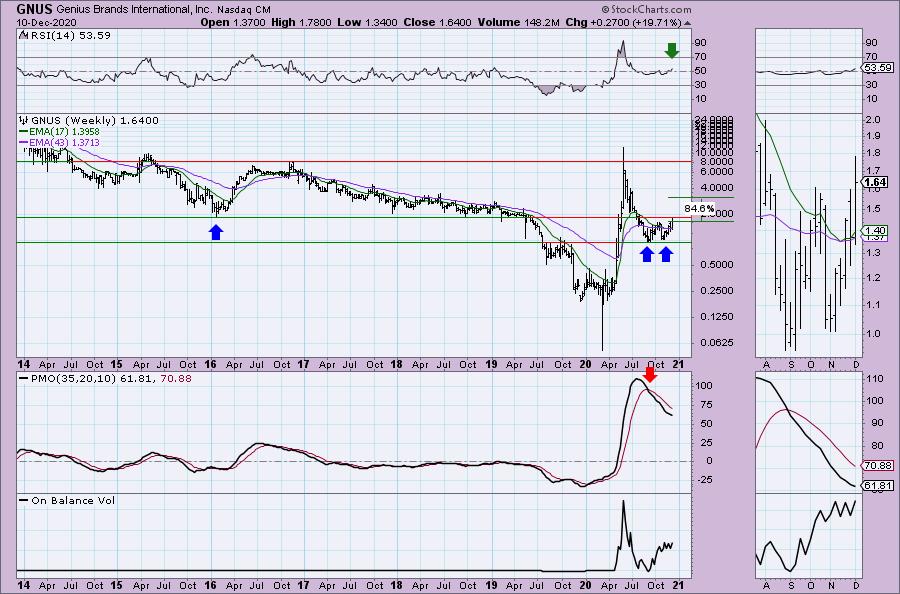
The double-bottom is more clear on the weekly chart. It really does look textbook, coming in off a dreadful decline. The RSI is just moving positive. The PMO is decelerating somewhat, given that decline and the momentum logged, it makes sense that it is taking some time to turn the train around. The 17-week EMA did manage to avoid a negative crossover the 43-week EMA. Upside potential is determined by the minimum upside target of the double-bottom pattern. That would be a fantastic gain. The risk level is very very high.
Don't forget, on Thursdays I look at reader-requested symbols, so shoot me an email at erin@decisionpoint.com. I read every email I receive and try to answer them all!
Microsoft Corp. (MSFT)
EARNINGS: 1/27/2021 (AMC)
Microsoft Corp. engages in the development and support of software, services, devices, and solutions. It operates through the following business segments: Productivity and Business Processes; Intelligent Cloud; and More Personal Computing. The Productivity and Business Processes segment comprises products and services in the portfolio of productivity, communication, and information services of the company spanning a variety of devices and platform. The Intelligent Cloud segment refers to the public, private, and hybrid serve products and cloud services of the company which can power modern business. The More Personal Computing segment encompasses products and services geared towards the interests of end users, developers, and IT professionals across all devices. The firm also offers operating systems; cross-device productivity applications; server applications; business solution applications; desktop and server management tools; software development tools; video games; personal computers, tablets; gaming and entertainment consoles; other intelligent devices; and related accessories. The company was founded by Paul Gardner Allen and William Henry Gates III in 1975 and is headquartered in Redmond, WA.
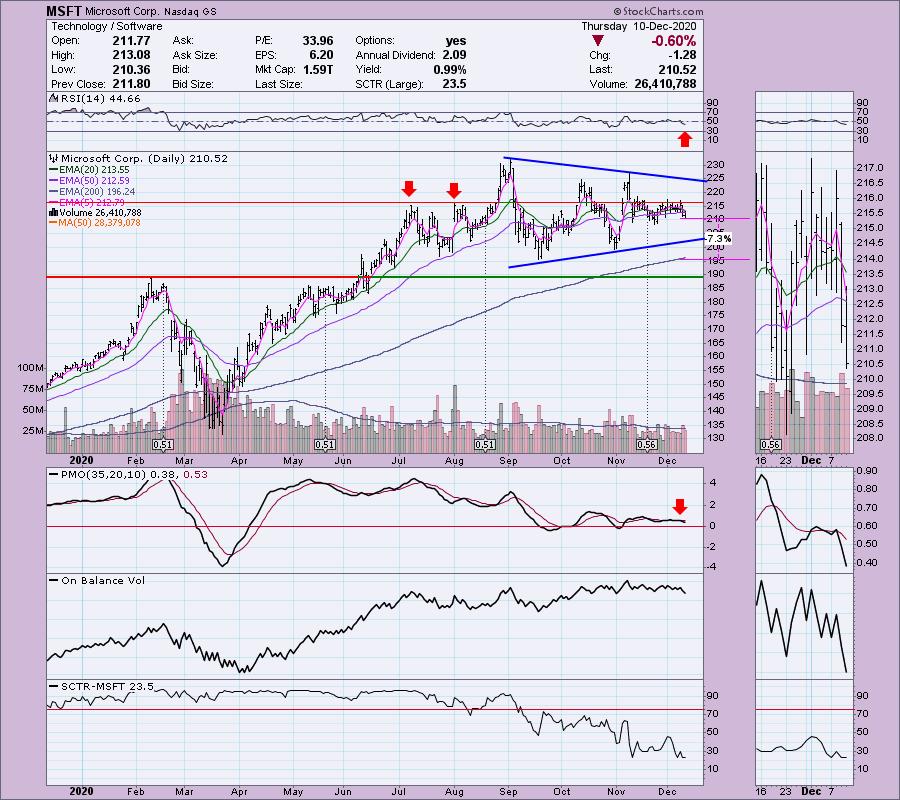
I've covered MSFT four times already, March 10th (up 30.8%), April 17th as a reader request (up 18.9%), June 9th (up 10.9%) and finally on August 25th (down -2.7%). Yes, Gary, it is definitely a symmetrical triangle. It looks very similar to Amazon (AMZN) which was a Diamond of the Week two weeks ago. Like AMZN, MSFT hasn't done much. It has been consolidating sideways for so long, the EMAs have braided and really aren't helpful due to whipsaw. The RSI is now in negative territory and the PMO is especially ugly. My sense is that we are going to see MSFT decline toward a test of the rising bottoms trendline that forms the bottom of the triangle before we see it test the top. The SCTR value is the lowest we've seen all year.
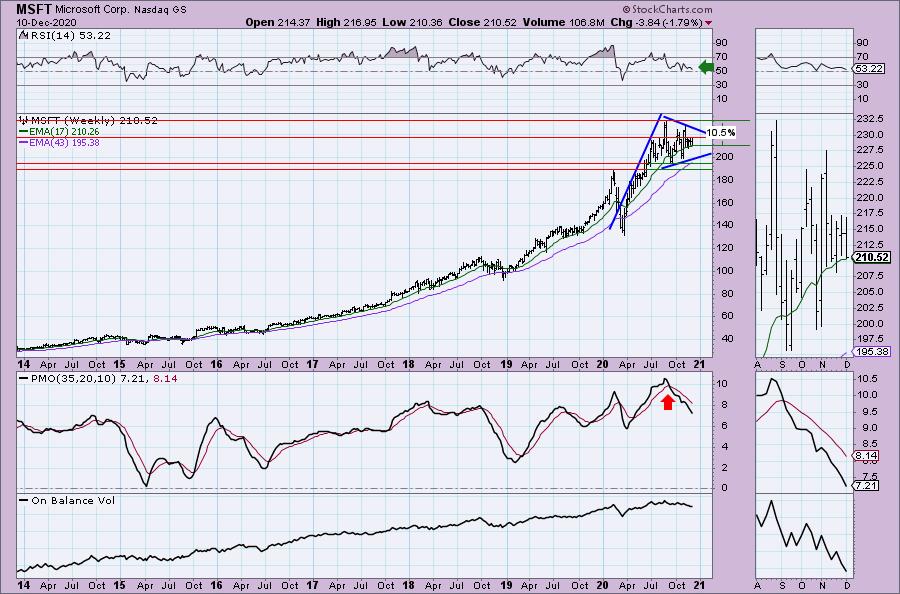
Like Apple, I think you can make a case for a flagpole and pennant which does suggest an upside breakout. However, the PMO is on a SELL signal and isn't decelerating. The RSI is positive right now, but it is heading toward negative territory.
Peloton Interactive Inc. (PTON) - Possible Short?
EARNINGS: 2/3/2021 (AMC)
Peloton Interactive, Inc. operates at-home fitness platform for live and on-demand indoor cycling classes. The company pioneered connected, technology-enabled fitness, and the streaming of immersive, instructor-led boutique classes for its Members. It operates through three reportable segments: Connected Fitness Products, Subscription and Other. The Connected Fitness Product segment consists of sales of bike, tread & related accessories. The Subscription segment involves in the monthly subscription and credits from live studio classes. The Other segment consists of boutique and apparel sales. The Peloton Interactive was founded on by John Foley, Graham Stanton, Thomas Cortese, Yony Feng and Hisao Kushi in 2012 and is headquartered in New York, NY.
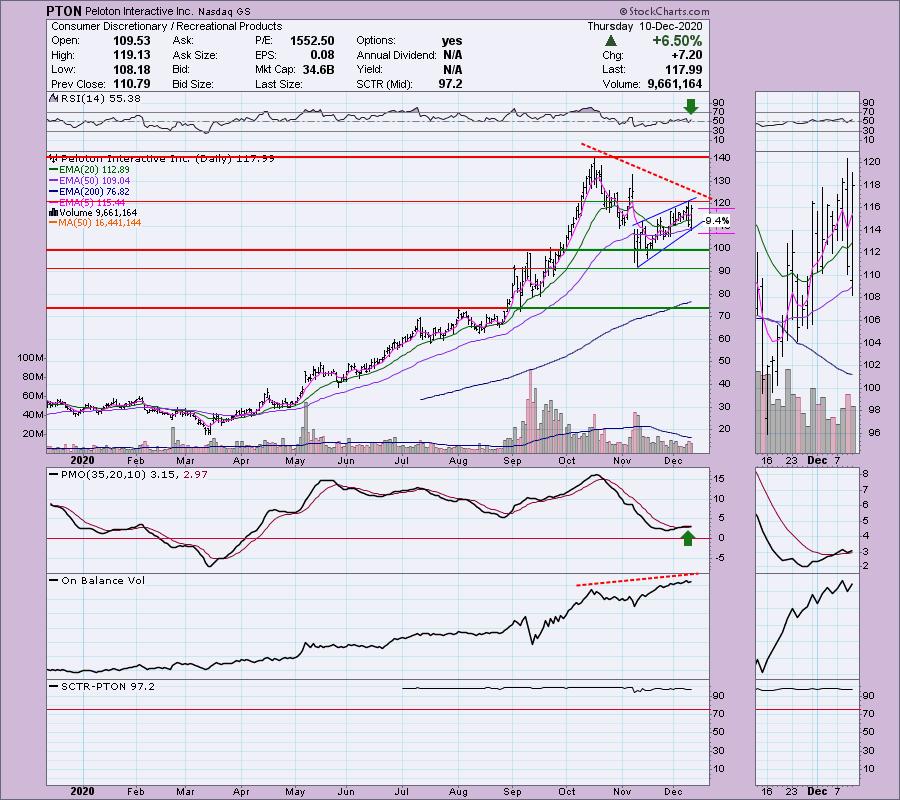
I covered this one as a reader request on April 2nd (up a whopping 341.2%!) and just recently on December 2nd (up a modest 4.2%). I have to say, I'm still bullish on it. I do see some bearish information on this chart, but overall I have to say I wouldn't be shorting this one unless it was in the very short term. Bearish: rising wedge and reverse OBV divergence. Bullish: Positive RSI, PMO BUY signal and new PMO bottom above the signal line in oversold territory. I think the positives outweigh the negatives for this to be a shorting opportunity.
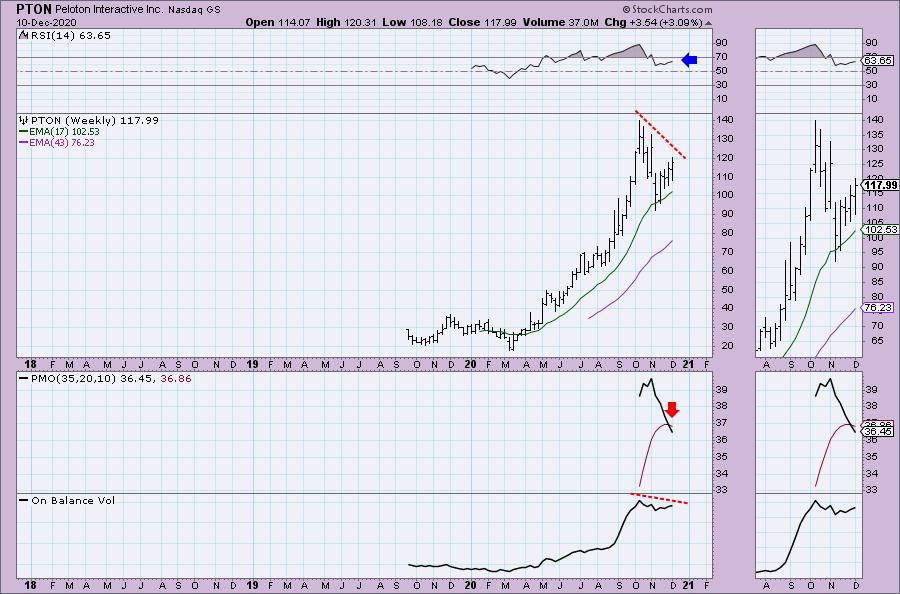
The weekly chart has more negatives than positives with a PMO SELL signal and confirming OBV. The RSI is positive. I always mention that with a lack of data on the PMO, I would take whatever it is displaying with a grain of salt. However, in this case, I think that weekly PMO SELL signal is a problem for the intermediate term.
Tekla Healthcare Opportunies Fund (THQ)
EARNINGS: N/A
Tekla Healthcare Opportunities Fund operates as a closed-end investment fund and investment trust. The trust's investment objective is to seek current income and long-term capital appreciation through investing in companies engaged in the healthcare industry, including equity securities, debt securities and pooled investment vehicles. The Trust was founded on April 2, 2014 and is headquartered in Boston, MA.
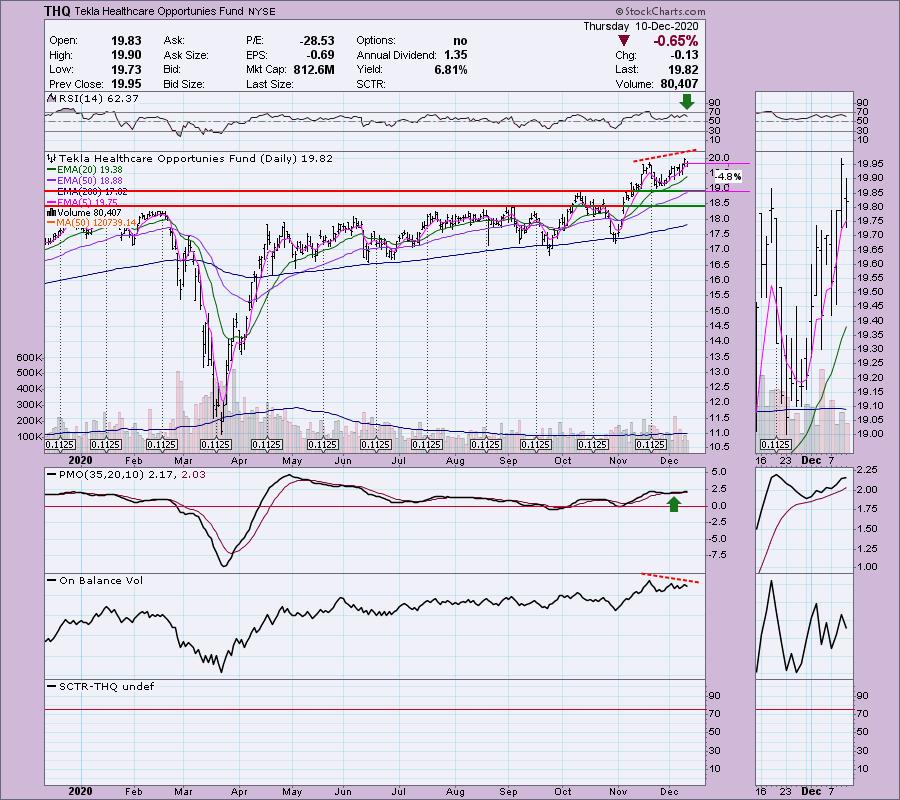
I liked this ETF and it is covering the Healthcare stocks where I am getting more bullish. The PMO is rising and it isn't that overbought. We also see that it has bottomed above the signal line. The RSI is positive. However, the negative divergence with the OBV isn't ideal. Fortunately you can set a very tight stop on this one.
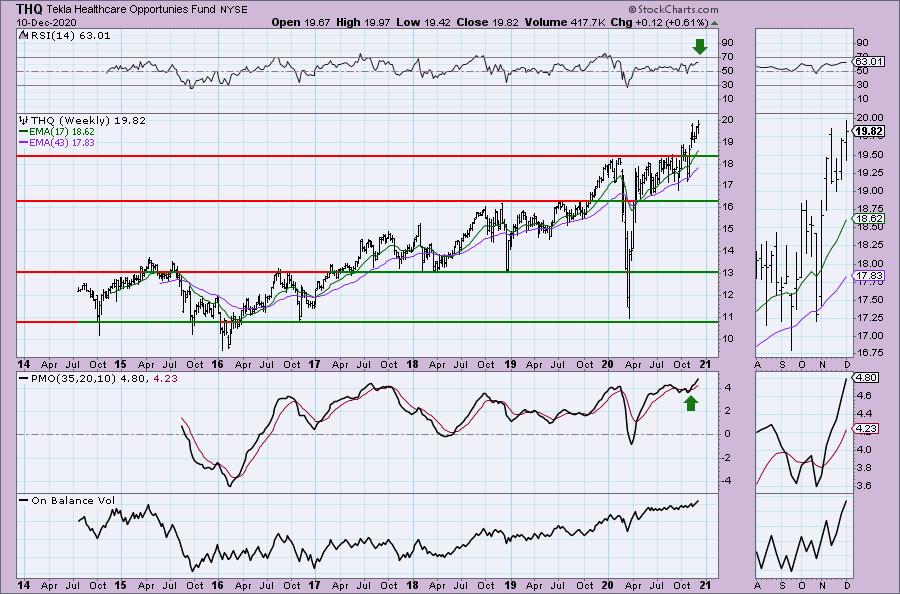
The weekly PMO is rising and on a BUY signal, I just wish it weren't so overbought. The RSI is positive and not overbought. The OBV is rising steadily and confirming the current rising trend.
Full Disclosure: I'm about 70% invested and 30% is in 'cash', meaning in money markets and readily available to trade with. I'm likely going to sell a few positions to lock in some profit this week.
Current Market Outlook:
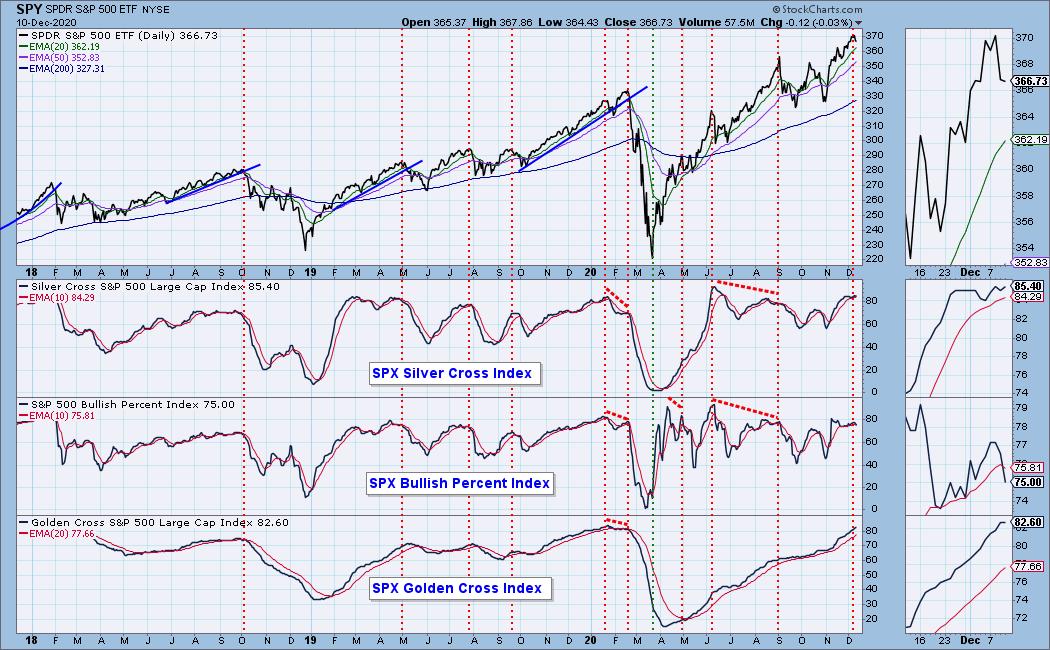
Market Environment: It is important to consider the odds for success by assessing the market tides. The following chart uses different methodologies for objectively showing the depth and trend of participation for intermediate- and long-term time frames.
- The Silver Cross Index (SCI) shows the percentage of SPX stocks on IT Trend Model BUY signals (20-EMA > 50-EMA)
- The Golden Cross Index (GCI) shows the percentage of SPX stocks on LT Trend Model BUY signals (50-EMA > 200-EMA)
- The Bullish Percent Index (BPI) shows the percentage of SPX stocks on Point & Figure BUY signals.
Don't forget that as a "Diamonds" member, you have access to our GCI/SCI curated ChartList on DecisionPoint.com. You'll find it under "Members Only" links on the left side on the Blogs and Links Page.
Here is the current chart:
Diamond Index:
- Diamond Scan Results: 3
- Diamond Dog Scan Results: 9
- Diamond Bull/Bear Ratio: 0.33
I'm in the process of trying to plot the Diamond Index, but with time at a premium, it is on the back burner.
Technical Analysis is a windsock, not a crystal ball.
Happy Charting!
- Erin
erin@decisionpoint.com
Watch the latest episode of DecisionPoint with Carl & Erin Swenlin on Mondays 7:00p EST or on the DecisionPoint playlist on the StockCharts TV YouTube channel here!
NOTE: The stocks reported herein are from mechanical trading model scans that are based upon moving average relationships, momentum and volume. DecisionPoint analysis is then applied to get five selections from the scans. The selections given should prompt readers to do a chart review using their own analysis process. This letter is not a call for a specific action to buy, sell or short any of the stocks provided. There are NO sure things or guaranteed returns on the daily selection of "diamonds in the rough."
Helpful DecisionPoint Links:
DecisionPoint Shared ChartList and DecisionPoint Chart Gallery
Price Momentum Oscillator (PMO)
Swenlin Trading Oscillators (STO-B and STO-V)
For more links, go to DecisionPoint.com!d