
It's Reader Request Day and I have some big names to share with you. The market is showing internal strength with SPY closing above its 50-day EMA. We have some more upside to eke out in the growth space so these reader requests fit that bill.
Yesterday I presented Xilinx (XLNX) but forgot that AMD is in the process of absorbing it. I was going to present AMD (which I own), but found a different semiconductor that I like better. However, as I was writing this article, the SPY tanked in after hours trading and AMD is down over 2.25% in after hours trading. The other Semi I picked is down more than 3.3%. Given this group has been leading the charge higher, it will probably lead the charge lower. I've tightened my stop on AMD.
I did expand my exposure to 20% today so that I can take advantage of short-term strength in growth stocks. I now have a position in all sectors with the exception of Real Estate, Discretionary and Communication Services.
Today's "Diamonds in the Rough": BLU, DHR, IBM, ODFL and ON.
Stocks to Review (No order): AMD, FTNT, NUE and YELL.

RECORDING LINK (1/28/2022):
Topic: DecisionPoint Diamond Mine (1/28/2022) LIVE Trading Room
Start Time: Jan 28, 2022 09:00 AM PT
Meeting Recording Link.
Access Passcode: January#28
REGISTRATION FOR THURSDAY 2/3 Diamond Mine:
When: Feb 3, 2022 09:00 AM Pacific Time (US and Canada)
Topic: DecisionPoint Diamond Mine (THURSDAY 2/3) LIVE Trading Room
Register in advance for this webinar HERE.
Save the registration confirmation email with login instructions in case Zoom doesn't notify you in time.

Topic: DecisionPoint Trading Room
Start Time: Jan 31, 2022 09:00 AM PT
Meeting Recording Link.
Access Passcode: January#31
For best results, copy and paste the access code to avoid typos.
Welcome to DecisionPoint Daily Diamonds, wherein I highlight ten "Diamonds in the Rough" per week. These are selected from the results of my DecisionPoint Scans, which search for stocks that could benefit from the trend and condition of the market. Remember, these are not recommendations to buy or sell, but are the most interesting of the stocks that surfaced in my scans. My objective is to save you the work of the initial, tedious culling process, but you need to apply your own analysis to see if these stocks pique your interest as well. There are no guaranteed winners here!
"Predefined Scans Triggered" are taken from the StockCharts.com using the "Symbol Summary" option instead of a "SharpChart" on the workbench.
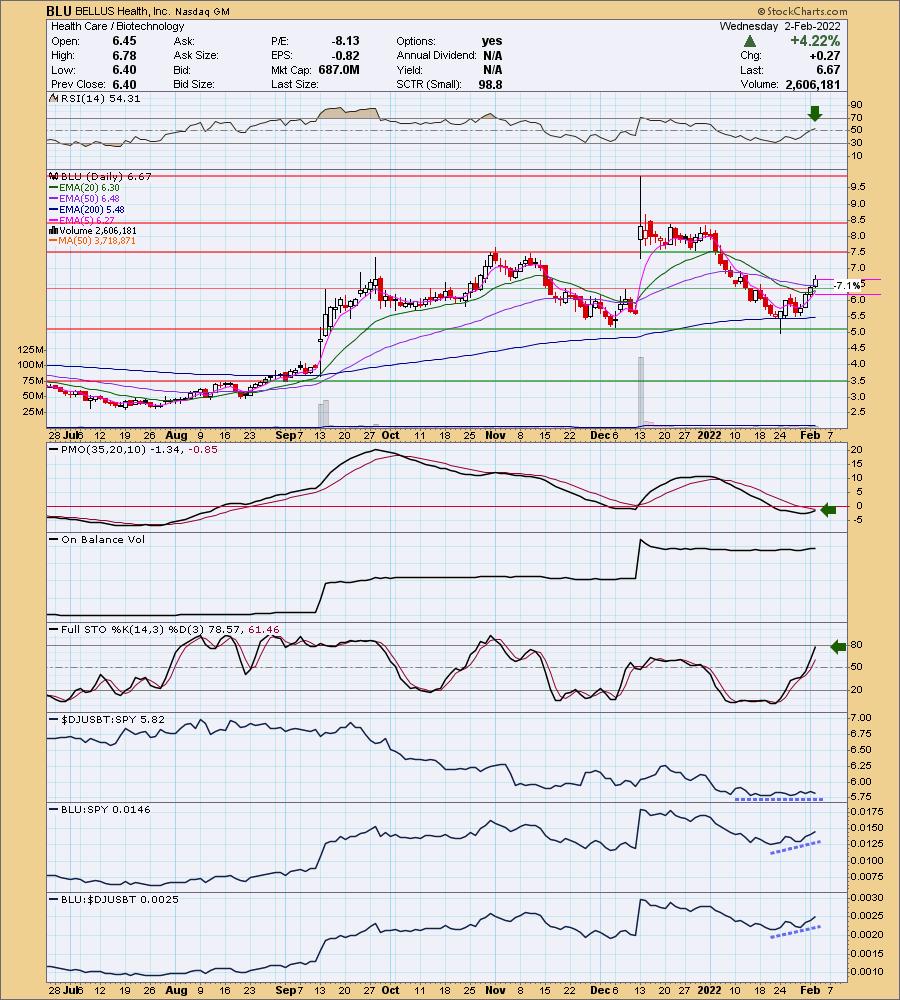
BELLUS Health, Inc. (BLU)
EARNINGS: 2/23/2022 (AMC)
BELLUS Health, Inc. is a clinical-stage biopharmaceutical company developing novel therapeutics for the treatment of cough hypersensitivity and other hypersensitization disorders. Its product BLU-5937, is being developed for the treatment of chronic cough and chronic pruritus, or chronic itch. The company was founded on June 17, 1993 and is headquartered in Laval, Canada.
Predefined Scans Triggered: Improving Chaikin Money Flow.
BLU is down -0.15% in after hours trading. I like this bottoming formation on the 200-day EMA. Today price tackled and closed above the 50-day EMA. The RSI just hit positive territory and the PMO is working toward a crossover BUY signal. Stochastics are strong and should reach above 80 shortly. Biotechs as a group are performing in line with the market, but BLU is outperforming them both. Just be careful here, Biotechs are volatile. The stop is set below the 20-day EMA.
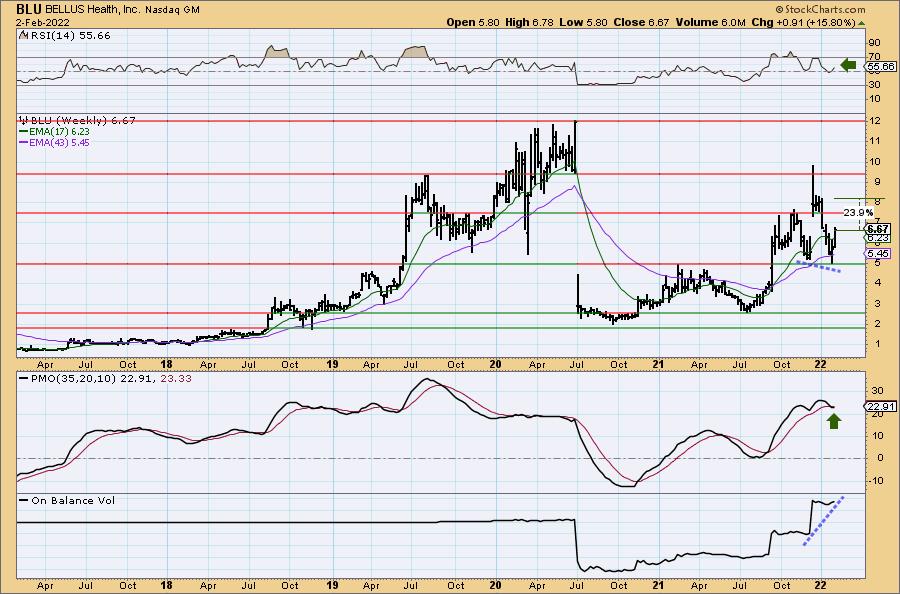
The weekly RSI is positive and rising. The weekly PMO did just trigger a crossover SELL signal, but with this week's 15%+ rally, it is already turning back up. There is a very strong positive divergence between the weekly OBV and price lows. Upside target is set just above the 2021 closing price high.
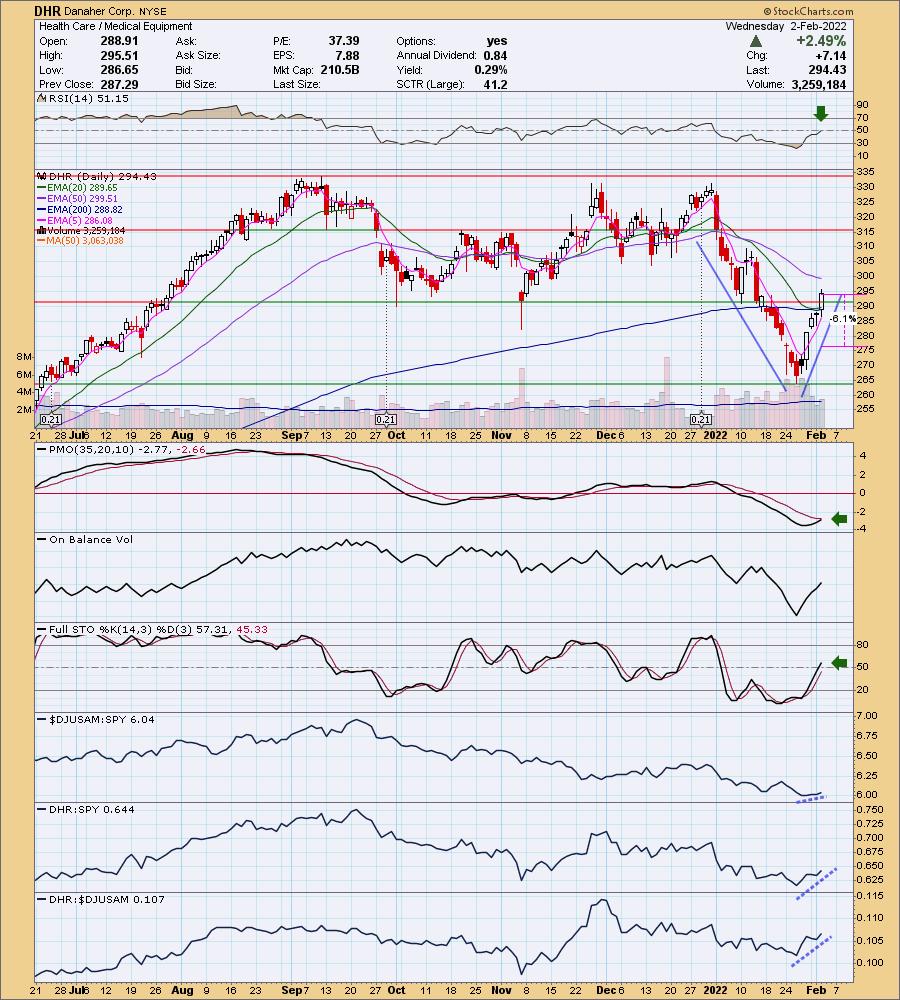
Danaher Corp. (DHR)
EARNINGS: 4/21/2022 (BMO)
Danaher Corp. operates as a medical company, which designs, manufactures, and markets professional, medical, industrial, and commercial products and services. It operates through the following segments: Life Sciences, Diagnostics, and Environmental & Applied Solutions. The Life Sciences segment offers a range of research tools that scientists use to study the basic building blocks of life, including genes, proteins, metabolites and cells, to understand the causes of disease, identify new therapies and test new drugs and vaccines. The Diagnostics segment is composed of analytical instruments, reagents, consumables, software, and services that hospitals, physicians' offices, reference laboratories, and other critical care settings use to diagnose disease and make treatment decisions. The Environmental & Applied Solution segment offers products and services that help protect important resources and keep global food and water supplies safe. The company was founded by Steven M. Rales and Mitchell P. Rales in 1969 and is headquartered in Washington, DC.
Predefined Scans Triggered: P&F Low Pole.
DHR is down -1.50% in after hours trading. I've covered DHR twice before on June 1st 2020 (position is still open and up +78.0%) and on December 21st 2020 (position is still open and up +30.2%). I like the "V" bottom on DHR. The pattern is bullish and implies a breakout above the left side of the "V". Price closed above both the 20/200-day EMAs as well as above resistance at the October lows. The RSI just turned positive and the PMO is nearing a crossover BUY signal. Stochastics are rising and hit positive territory today. The group is just beginning to outperform a bit, DHR has been outperforming for the past week. The stop is set rather tightly about halfway down the right side of the "V".
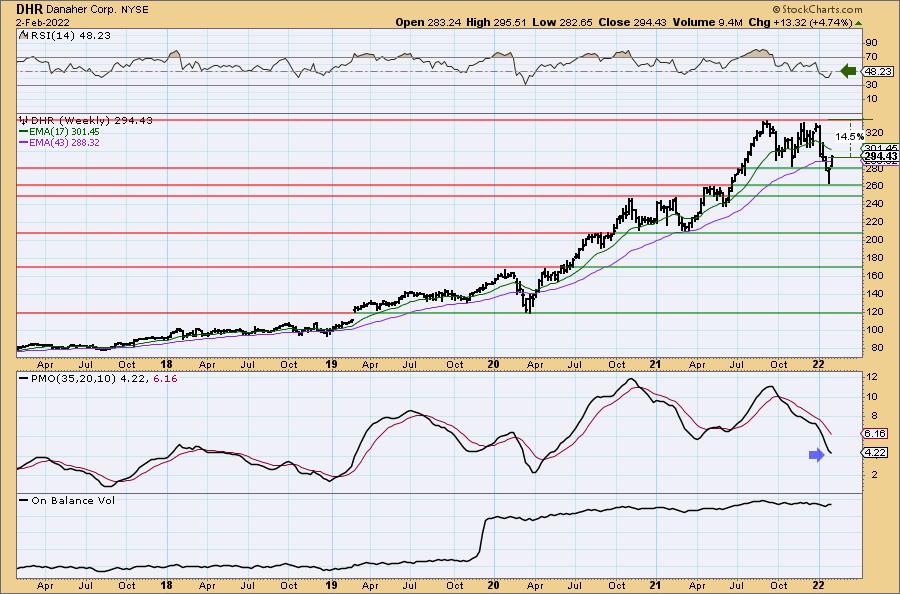
Should DHR recapture all-time highs, the gain would be about 14.5%. The weekly RSI is still negative, but climbing. The PMO is negative, but it is in oversold territory and may be decelerating its decline.
International Business Machines (IBM)
EARNINGS: 4/18/2022 (AMC)
International Business Machines Corp. is an information technology company, which provides integrated solutions that leverage information technology and knowledge of business processes. It operates through the following segments: Cloud and Cognitive Software, Global Business Services, Global Technology Services, Systems, and Global Financing. The Cloud and Cognitive Software segment provides integrated and secure cloud, data, and solutions to the clients. The Global Business Services segment provides clients with consulting, application management, and business process outsourcing services. The Global Technology Services segment provides comprehensive IT infrastructure and platform services that create business value for clients. The Systems segment provides clients with innovative infrastructure platforms to help meet the requirements of hybrid cloud and enterprise AI workload. The Global Financing segment provides client financing, commercial financing, and participates in the remanufacturing and remarketing of used equipment. The company was founded by Charles Ranlett Flint and Thomas J. Watson Sr. on June 16, 1911 and is headquartered in Armonk, NY.
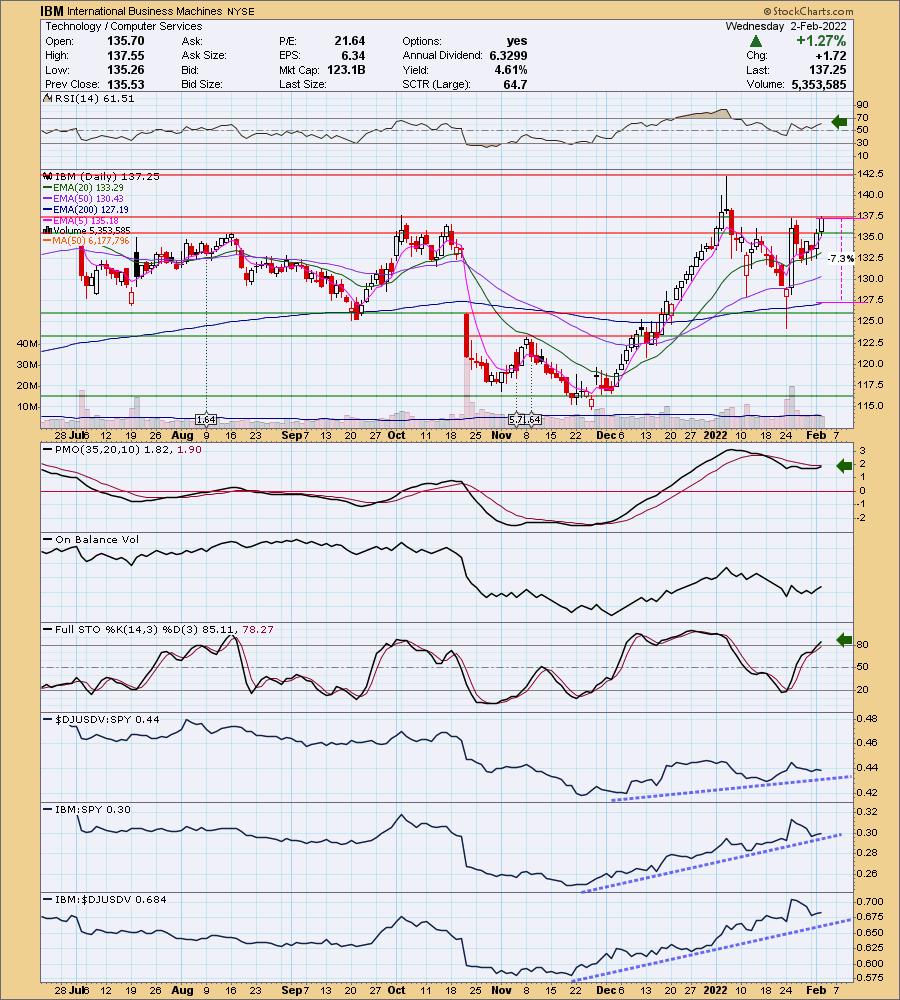
Predefined Scans Triggered: New CCI Buy Signals.
IBM is down -0.73% in after hours trading. I covered IBM on February 13th 2020. Given that was picked at the beginning of the bear market, the position was stopped out fairly quickly. IBM may be in the Technology space, but it carries a very high yield of 4.61% so we get the benefit of a solid company in Technology as well as a high dividend. Currently IBM is pushing against strong overhead resistance. Given the positive RSI, nearing PMO BUY signal and Stochastics rising above 80, I believe it will eventually breakout here. The stop is set at the 200-day EMA, but a loss of the 50-day EMA as support would be a sell signal. Outperformance has been rising for the group since the December low. IBM has been performing well since the December low.
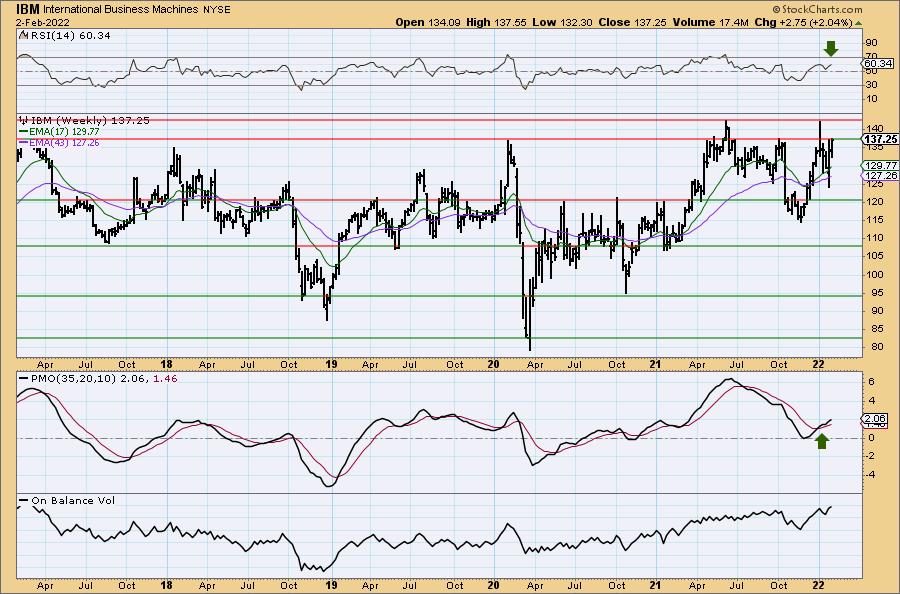
We can see that we are at the 2020 high and there is more resistance ahead. However, the weekly indicators are very favorable with a positive RSI, PMO BUY signal and improving OBV. Since it is near highs on the weekly chart, I went to the monthly chart to find an upside target. Apparently it is only 7.3% away from all-time highs so consider an upside target of about 14% at $156.50.
Old Dominion Freight Line, Inc. (ODFL)
EARNINGS: 2/2/2022 (BMO) ** REPORTED TODAY **
Old Dominion Freight Line, Inc. engages in the provision of less-than-truckload services. The firm offers regional, inter-regional, and national less-than-truckload services. Its services also include container drayage, truckload brokerage, supply chain consulting, and warehousing. The company was founded by Earl Congdon Sr. and Lillian Congdon in 1934 and is headquartered in Thomasville, NC.
Predefined Scans Triggered: Elder Bar Turned Green, Bullish MACD Crossovers and P&F Low Pole.
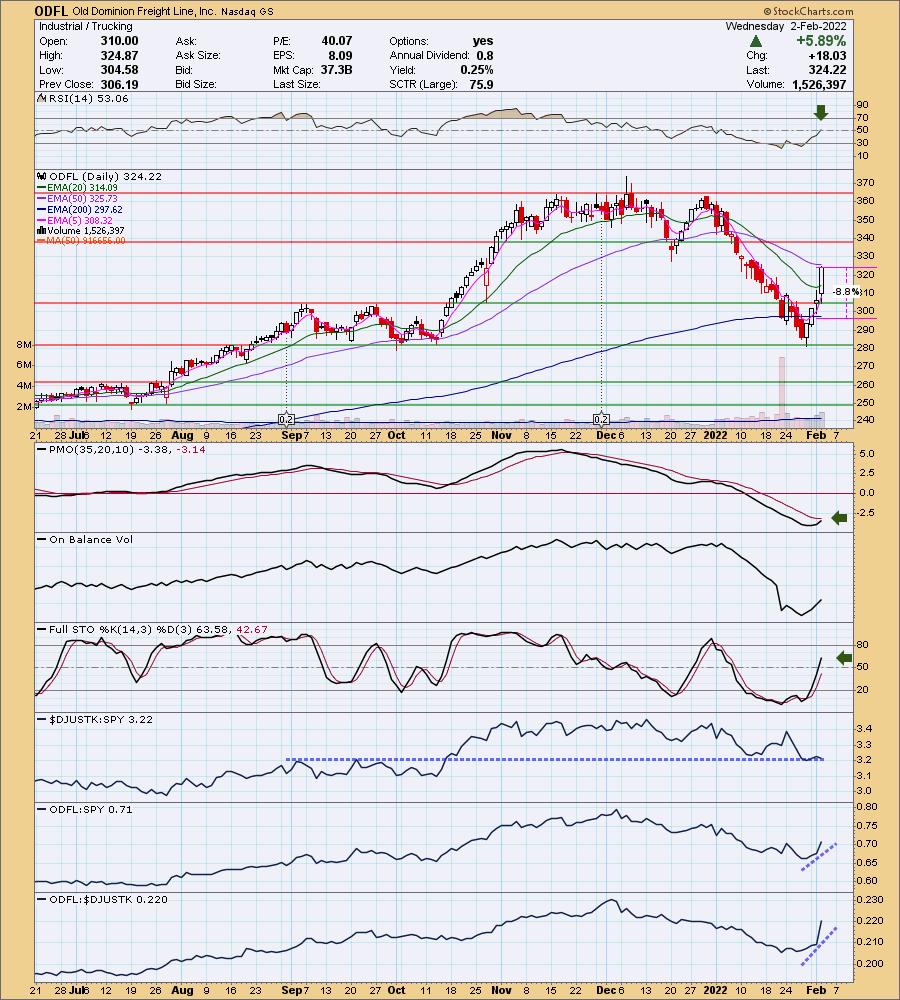
ODFL is unchanged in after hours trading. It reported earnings today and they were received well. I covered ODFL three times in 2020 on March 26th 2020 (no stop was set but based on the chart, I would've set one around $130 and that level was broken in April), on August 12th 2020 (again for whatever reason, I didn't set a stop, but reviewing the chart, I would've set one at about $175.50 so position is technically open and up +68.6%) and on October 7th 2020 (position is still open and up +68.1%).
Today's breakout above the 20-day EMA on earnings was good. It has formed a "V" bottom which suggests a breakout above all-time highs. The RSI is now positive and the PMO is going in for an oversold crossover BUY signal. Stochastics are rising strongly in positive territory. The group has done so well in 2022, but it is now at relative support. ODFL is outperforming both the market and the group now. The stop is set below the 200-day EMA.
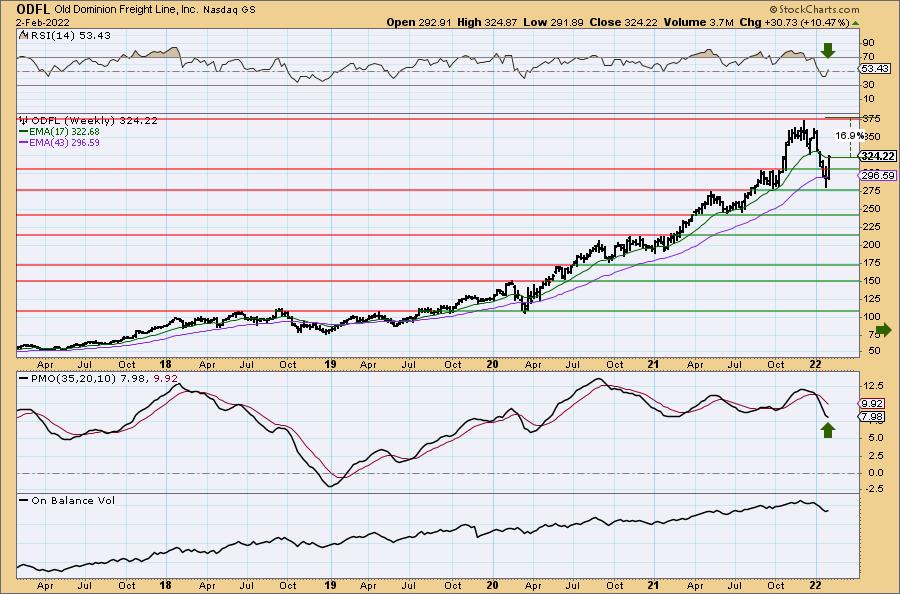
The weekly chart is improving with the weekly RSI back in positive territory and the weekly PMO decelerating. Upside target is at all-time highs for a gain of almost 17%.
ON Semiconductor Corp. (ON)
EARNINGS: 2/7/2022 (BMO)
ON Semiconductor Corp. is engaged in disruptive innovations and also a supplier of power and analog semiconductors. The firm offers vehicle electrification and safety, sustainable energy grids, industrial automation, and 5G and cloud infrastructure, with a focus on automotive and industrial end-markets. It operates through the following segments: Power Solutions Group, Advanced Solutions Group, and Intelligent Sensing Group. The Power Solutions Group segment offers discrete, module, and semiconductor products that perform multiple application functions, including power switching, power conversion, signal conditioning, circuit protection, signal amplification, and voltage reference functions. The Advanced Solutions Group segment is involved in the designing and developing of analog, mixed-signal, advanced logic, ASSPs and ASICs, Wi-Fi and power solutions for a broad base of end-users in the automotive, consumer, computing, industrial, communications, medical and aerospace/defense markets. The Intelligent Sensing Group segment is focused on the designing and developing of CMOS and CCD image sensors, as well as proximity sensors, image signal processors, single photon detectors, including SiPM and SPAD arrays. The company was founded on July 4, 1999 and is headquartered in Phoenix, AZ.
Predefined Scans Triggered: Bullish MACD Crossovers and P&F Double Top Breakout.
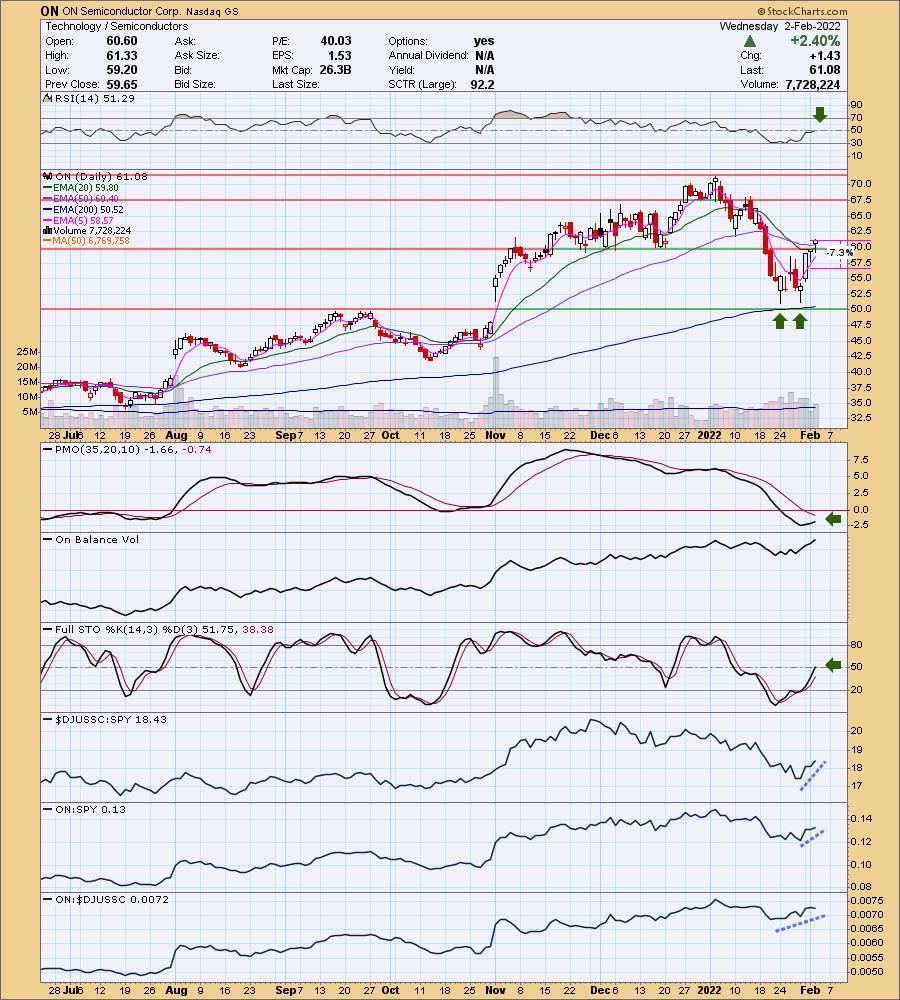
ON is down -3.16% in after hours trading which is troubling (AMD is down -2.44%). If that decline holds, the bullish features will quickly disappear. I liked the closing chart with the RSI just turning positive and price breaking out above overhead resistance at the 50-day EMA and December lows. Stochastics just hit positive territory and are rising. The group is showing outperformance this week and ON has been outperforming the group and SPY. However, I now question this group if two leaders are falling fast in after hours trading (someone obviously clued them in that I bought AMD). You have the benefit of timing an entry or aborting one if the 5-minute candlestick chart isn't ripe. The SPY dove in after hours trading and that is a problem as well.
We timed it well when I covered ON on October 19th 2021 as the stop never hit so it is up +35.9%. I really like the double-bottom formation and the breakout (but we know the breakout is failing). The RSI just moved into positive territory and the PMO is rising out of oversold territory. Stochastics just moved into positive territory. The group has been carrying much of the current rally and ON is performing slightly better than the group and SPY. The stop is set about halfway into the double-bottom pattern. If price does pullback here, I might consider an entry if it tests the 200-day EMA again successfully.
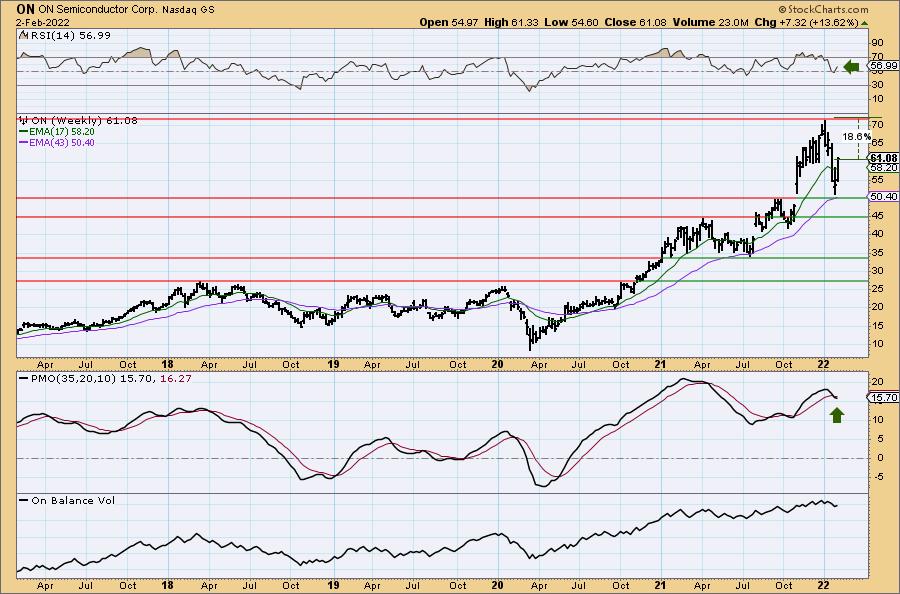
The weekly chart was looking up too. The weekly RSI is positive and rising and the weekly PMO is bottoming. That could change if the rally fails. If we do see follow-through, it would be an 18%+ gain if it recaptures all-time highs.
Don't forget, on Thursdays I look at reader-requested symbols, click HERE to shoot me an email. I read every email I receive and try to answer them all!
Current Market Outlook:
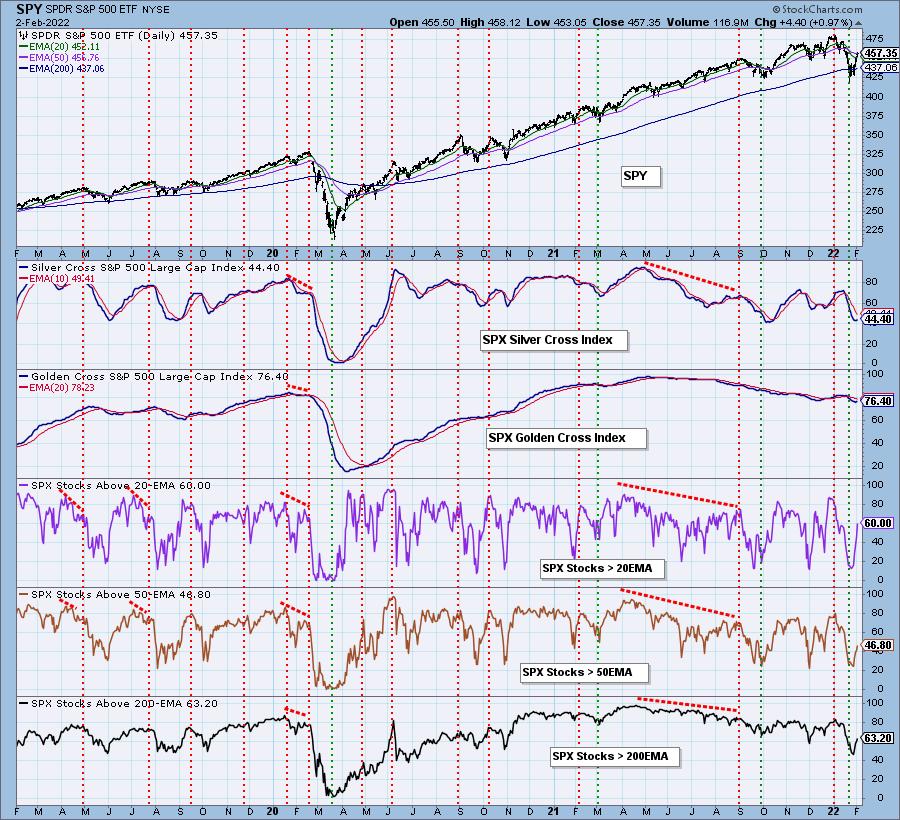
Market Environment: It is important to consider the odds for success by assessing the market tides. The following chart uses different methodologies for objectively showing the depth and trend of participation for intermediate- and long-term time frames.
- The Silver Cross Index (SCI) shows the percentage of SPX stocks on IT Trend Model BUY signals (20-EMA > 50-EMA)
- The Golden Cross Index (GCI) shows the percentage of SPX stocks on LT Trend Model BUY signals (50-EMA > 200-EMA)
Don't forget that as a "Diamonds" member, you have access to our GCI/SCI curated ChartList on DecisionPoint.com. You'll find it under "Members Only" links on the left side on the Blogs and Links Page.
Here is the current chart:
Full Disclosure: I'm 20% invested and 80% is in 'cash', meaning in money markets and readily available to trade with. I mentioned AMD which I own.
I'm required to disclose if I currently own a stock and/or may buy it within the next 72 hours.
Happy Charting!
- Erin
"Technical Analysis is a windsock, not a crystal ball." - Carl Swenlin
(c) Copyright 2022 DecisionPoint.com
Watch the latest episode of DecisionPoint with Carl & Erin Swenlin on Mondays 7:00p EST or on the DecisionPoint playlist on the StockCharts TV YouTube channel here!
NOTE: The stocks reported herein are from mechanical trading model scans that are based upon moving average relationships, momentum and volume. DecisionPoint analysis is then applied to get five selections from the scans. The selections given should prompt readers to do a chart review using their own analysis process. This letter is not a call for a specific action to buy, sell or short any of the stocks provided. There are NO sure things or guaranteed returns on the daily selection of "Diamonds in the Rough."
Helpful DecisionPoint Links:
DecisionPoint Shared ChartList and DecisionPoint Chart Gallery
Price Momentum Oscillator (PMO)
Swenlin Trading Oscillators (STO-B and STO-V)
For more links, go to DecisionPoint.com